
Figure 7.
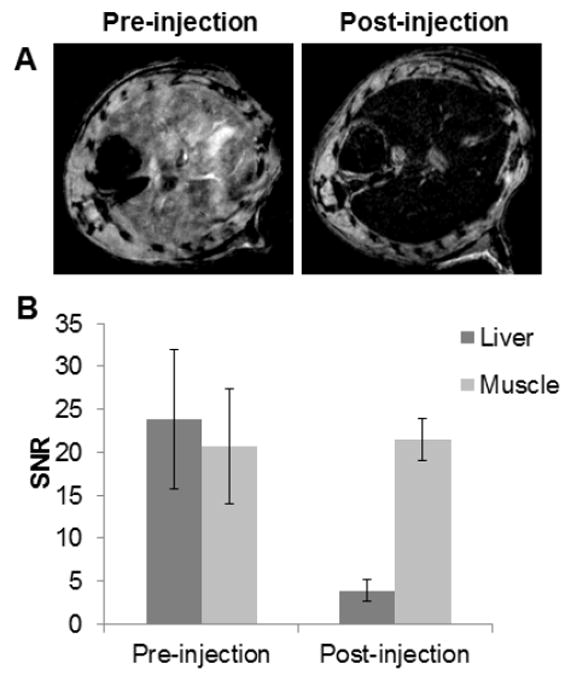
A) In vivo MR images of the liver of mice before and 2 hours after injection with BION (Bi-30). B) Quantitation of the MR signal intensity in mouse livers compared between pre- and post-injection images. Error bars are standard deviations.
Official websites use .gov
A
.gov website belongs to an official
government organization in the United States.
Secure .gov websites use HTTPS
A lock (
) or https:// means you've safely
connected to the .gov website. Share sensitive
information only on official, secure websites.
A) In vivo MR images of the liver of mice before and 2 hours after injection with BION (Bi-30). B) Quantitation of the MR signal intensity in mouse livers compared between pre- and post-injection images. Error bars are standard deviations.