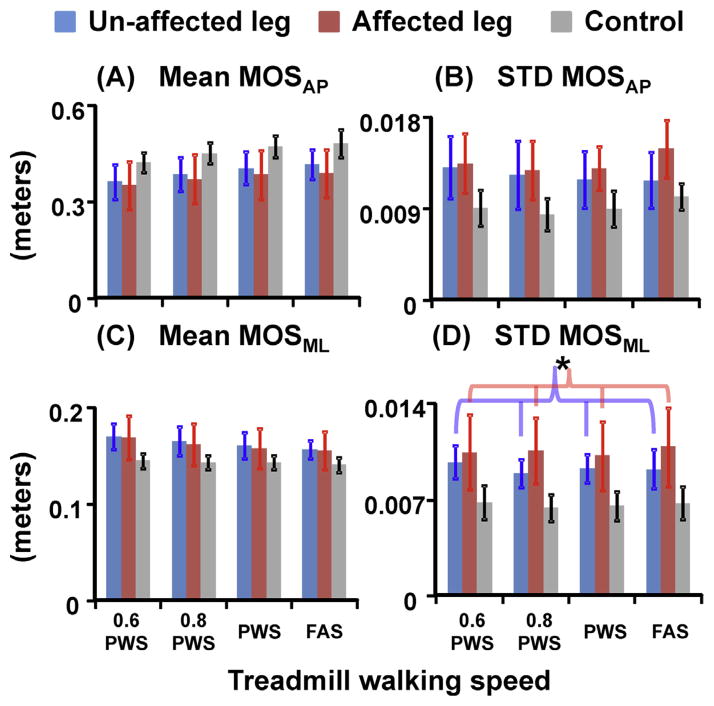
Fig. 2.
(A) Mean and (B) variability of MOSAP, and (C) mean and (D) variability of MOSML for unimpaired control leg (grey bars), stroke unaffected leg (blue bars), and stroke affected leg (red bars). Error bars are ±1 STD. * Indicates significant difference between the unaffected and affected legs in post-stroke individuals (THSD, p < 0.05). There was a significant group effect for average MOSAP, MOSAP variability, and MOSML variability. In addition, there was a speed effect for average MOSAP and average MOSML. (For interpretation of the references to color in this figure legend, the reader is referred to the web version of this article.)

