Figure 3.

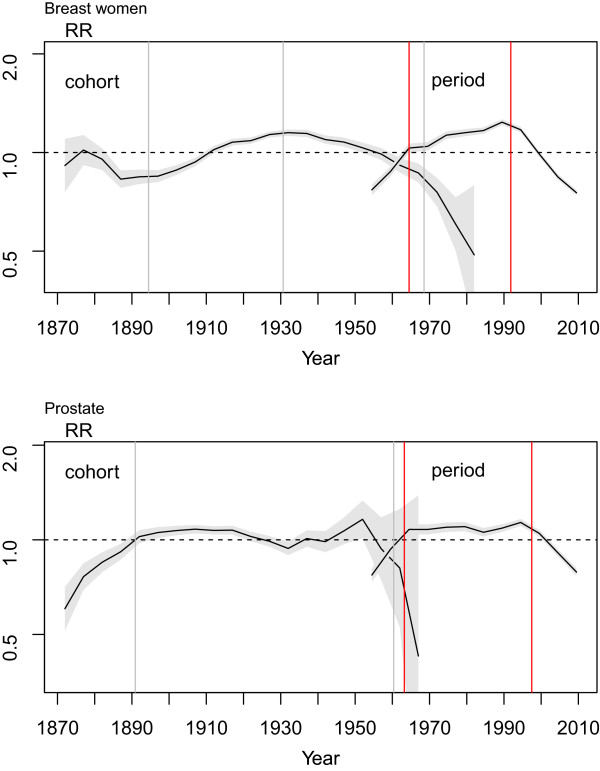
Cohort and period effect curvatures and 95% confidence interval (shadow) for breast and prostate cancer mortality in Spain. Years of change point are indicated with vertical lines, grey for cohort effect and red for period effect.

Cohort and period effect curvatures and 95% confidence interval (shadow) for breast and prostate cancer mortality in Spain. Years of change point are indicated with vertical lines, grey for cohort effect and red for period effect.