
Figure 5.
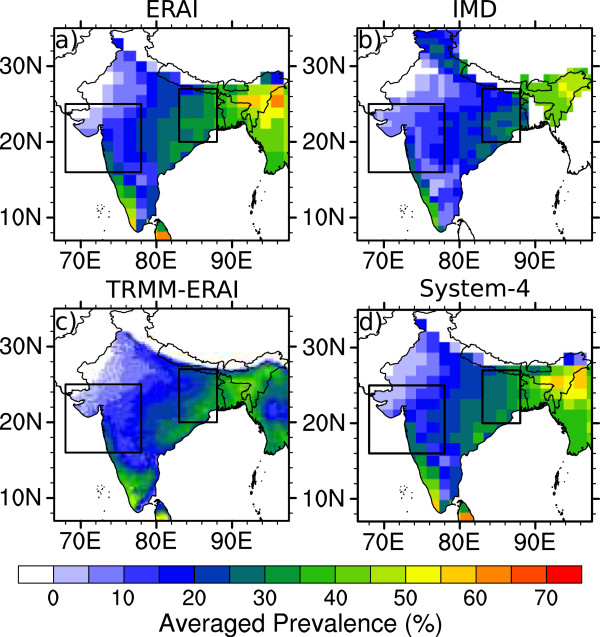
Annual average malaria prevalence (%). Output is shown from the Liverpool Malaria Model (LMM) driven by a) ERAI (1981–2010), b) IMD (1981–2002), c) TRMM precipitation and ERAI temperature (TRMM-ERAI, 1998–2010) and d) the System-4 forecast (1981–2010) monthly time series with a three month lead time (see Figure 1a). The two boxes enclose the regions of interest in Northwest and Northeast India.