
Figure 7.
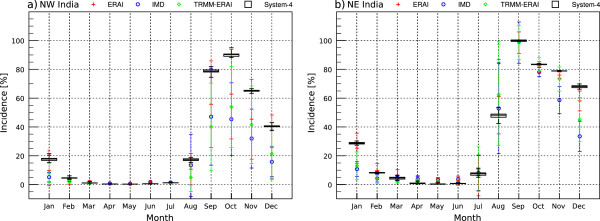
Average seasonal cycle of malaria incidence (%). Values are shown for ERAI (1981–2010), IMD (1981–2002), TRMM precipitation and ERAI temperature (TRMM-ERAI, 1998–2010) and the System-4 forecast monthly time series with a three month lead time (see Figure 1a) in a) Northwest India and b) Northeast India. Meteorological data-driven incidence spatial variability is illustrated by plus or minus one standard deviation of the mean. System-4 values are plotted as a box that shows the upper tercile, lower tercile and the mean of the 15 equally-weighted ensemble forecast members and the whiskers indicate the maximum and minimum values.