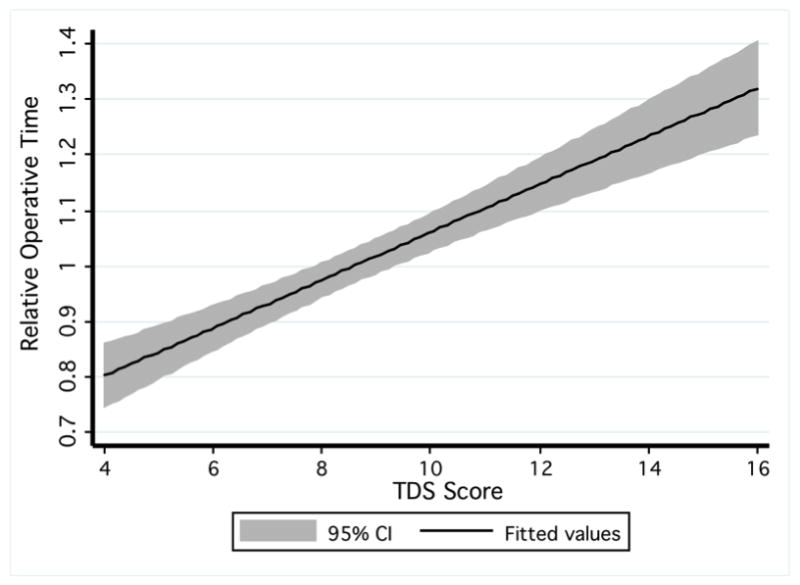
Figure 3. TDS Scores Correlate with Operative Time.

The line represents the linear regression between TDS scores and the adjusted operative times. The shaded area indicates the 95% confidence interval for the regression equation.

The line represents the linear regression between TDS scores and the adjusted operative times. The shaded area indicates the 95% confidence interval for the regression equation.