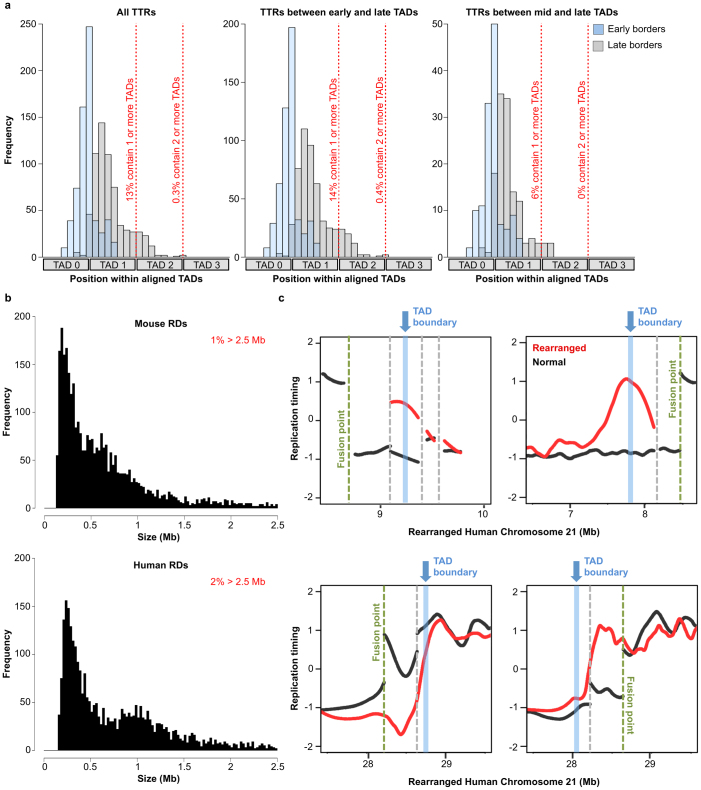
Extended Data Figure 6. Replication-timing shifts at chromosome rearrangements are restrained by TAD boundaries.
a, Distribution of early (blue) and late (grey) TTR borders within aligned, adjacent TADs for all TTRs (left), or TTRs that start in early (centre, timing > 0.5) or middle (right, timing ≤ 0.5) S phase. The right boundary of TAD 0 is nearest each early border and TADs 1–3 are neighbouring TADs in the direction of the timing transition (earlier to later from left to right). b, Histogram of replication domain sizes. c, Plots as in Fig. 2e show replication timing (red) across four rearrangement points (vertical green lines) that juxtapose otherwise early- and late-replicating regions on human chromosome 21 overlaid on the normal profile (black). Secondary rearrangement points (vertical grey lines) that joined regions with similar replication timing are also shown. The TAD boundary (vertical blue line) nearest to the fusion point is also indicated. In the examples at the top and bottom left, the shift forms a new TTR with its early border coinciding with the nearest TAD boundary. As in the other examples, the shift in the bottom right plot also does not extend beyond the nearest detected TAD boundary, but the TTR formed does not align with a called TAD boundary.

