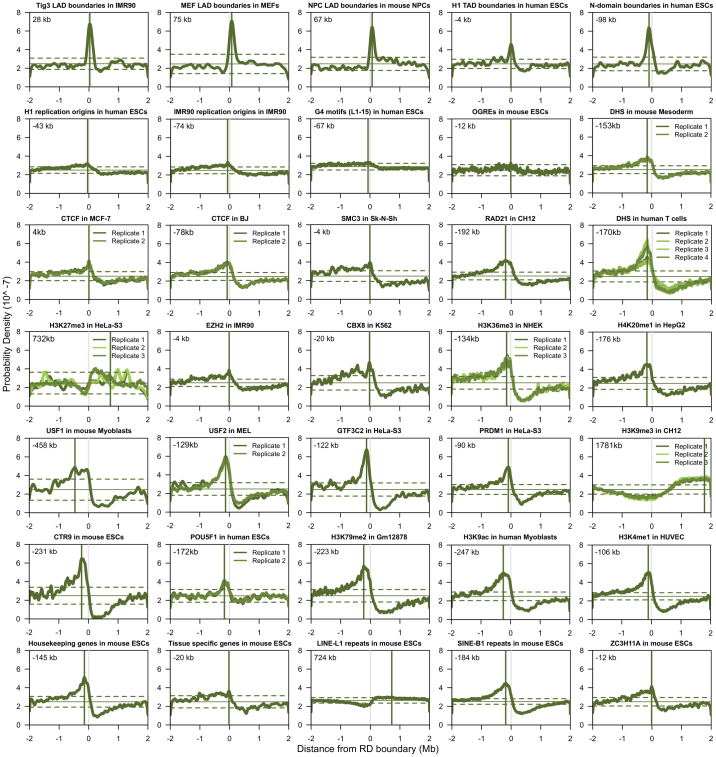
Extended Data Figure 7. Alignment of TTR-present replication domain boundaries to chromatin features.
Plots as in Fig. 3a, b show probability density functions (green curves) for selected chromatin features within 4 Mb of aligned replication domain boundaries in the indicated cell types. A vertical grey line indicates the replication domain boundary position and a vertical green line indicates the average position of maximum enrichment in replicate data sets, which is listed at the top left of each graph. Horizontal solid and dashed lines indicate the mean and three standard deviations from the mean probability density of each feature about an equal number of random positions.

