
Figure 2.
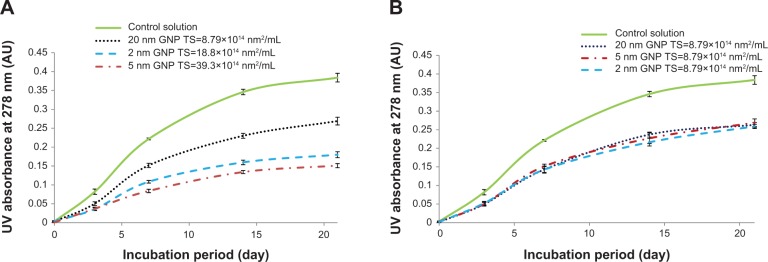
UV absorbance time course profiles of reaction mixtures containing 35 mg/mL BSA and 20 mM D-ribose with GNPs of different sizes (2 nm, 5 nm, and 20 nm) incubated at 37°C. (A) Incubation mixtures had colloidal suspensions of varied total surface area. (B) Incubation mixtures had GNPs of the same total surface area.
Notes: Aliquots (1 mL) from each sample were collected at different intervals (0, 3, 7, 14, and 21 days) and their UV intensities were measured in quartz cuvettes at 280 nm. All data points represent the average of triplicate measurements with the bars at each point representing the respective standard deviation.
Abbreviations: UV, ultraviolet; BSA, bovine serum albumin; GNP, gold nanoparticles; TS, total surface area.