Figure 3.
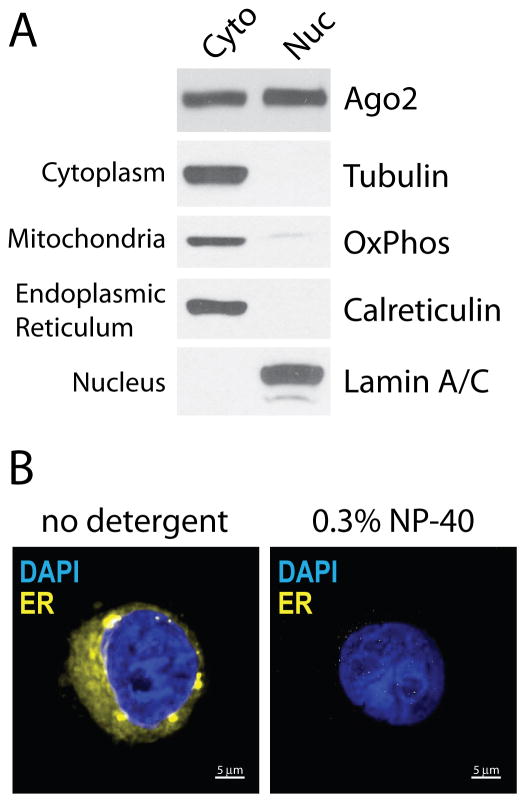
Quality assessment of subcellular fractionation. (A) Western blot analyses of cytoplasmic (Cyto) and nuclear (Nuc) fractions. Western analysis protocol followed is from Gagnon and colleagues29. (B) Fluorescence microscopy of isolated nuclei. Blue is DAPI stain, which binds chromatin DNA. Yellow is ER Tracker Red dye pseudocolored yellow, which binds sulfonlyurea receptors on the ER membrane surface. Scale bar = 5 μm.

