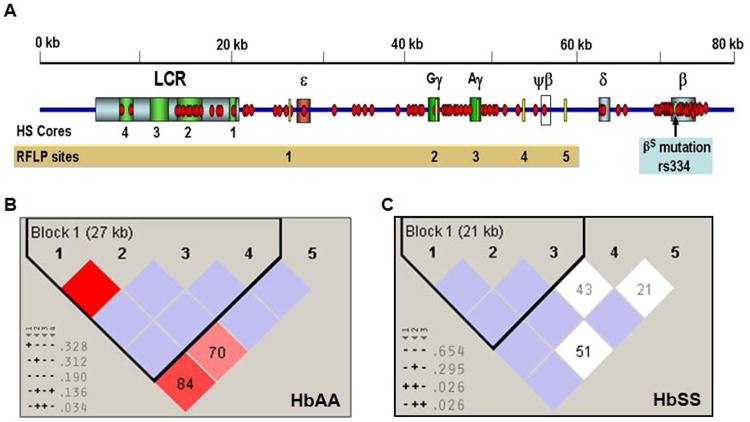
Fig. 1. β-haplotypes established using RFLP genotypes.

A) Schematic diagram showing the distributions of 88 SNPs (red dot) on the custom SNP-chip and five RFLP sites (yellow bar) that were analyzed. Each globin gene is indicated by a colored box and ψβ-globin is shown by a white box. The βS mutation (rs334) is shown as a green circle. Abbreviations: LCR, locus control region; HS, DNase I hypersensitive site. B) The linkage disequilibrium (LD) patterns and haplotypes established by Haploview analysis for the RFLP genotypes are shown for the HbAA subjects. Pair-wise computation was performed for the SNPs which are shown on each side of the boxes. The degree of LD is defined by value of D′ and LOD (the logarithm of the likelihood odds ratio), which is a measure of the confidence of D′ values. The red boxes indicate strong LD (LOD >2, D′ = 1), white boxes no LD (LOD < 2, D′ < 1), and pink (LOD = 2, D′ <1), and blue (LOD < 2, D′ =1) boxes indicate intermediated LD. The D′=1 unless indicated in the boxes where D′ is multiplied by 100. SNPs with strong LD were defined into haplotype blocks (black triangle) and the size of the region in LD is shown in parentheses. The inferred haplotypes and frequency observed are shown in the lower corner; htSNPs are indicated by a gray triangle beneath the RFLP number. Symbols: “+” = cut with the specific restriction enzyme used for analysis; “-“= no cut. C) The LD patterns and haplotypes for the RFLP genotypes established by Haploview analysis are shown for the HbSS group. The symbols are the same as defined in Panel B.
