
Fig. 2. Haploview-inferred haplotypes using SNP-chip genotypes.
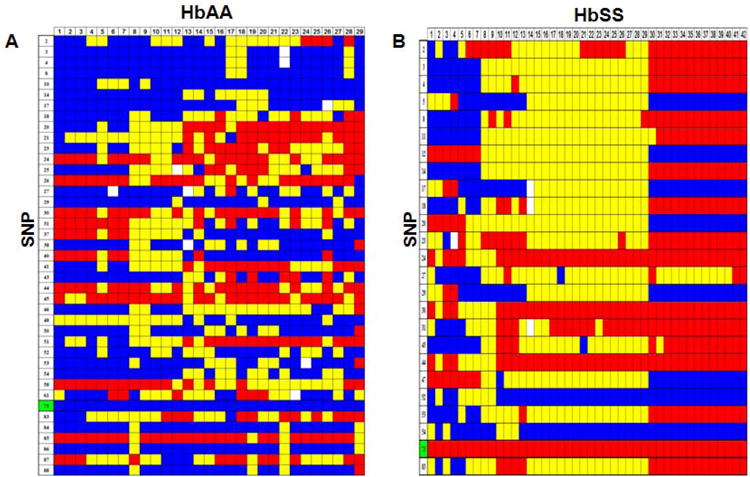
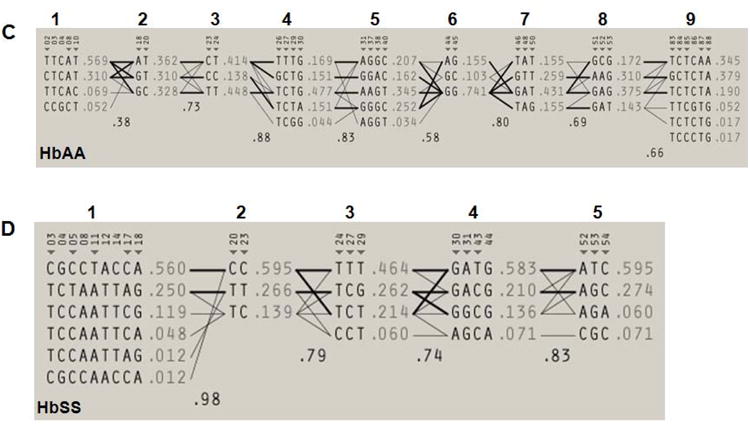
A) A genotype heat map was established for the HbAA subjects. Genotypes produced using the SNP-chip that satisfied the criteria detailed in Materials and Methods are shown. The rows represent the SNPs analyzed and the columns represent each DNA sample tested. SNPs are numbered according to that defined in Table 1; the βS SNP (rs334) is number 73 and is highlighted in green. At each SNP position, a blue box represents wild-type homozygous genotypes, a yellow box heterozygous and the red box homozygous mutant genotypes. White boxes indicate genotype data is missing for the SNP indicated. B) Genotype heat map for the HbSS subjects. The color code is the same as described in Panel A. C) Haploview software was used to infer haplotypes using SNP-chip genotype data for the HbAA subjects. The numbers in the gray shaded area represent the SNPs listed in Table 1. The inferred haplotypes in each haplotype block and linkage between blocks are shown. Nine haplotype blocks were defined (numbers above the gray shaded area). The lines between haplotype blocks indicate the linkage frequency with a thick line for > 10% and a thin line for a frequency from 1-10%. Haplotype-tagging SNPs (htSNPs) are indicated underneath the SNP numbers by a triangle (▼). Haplotype frequency within each haplotype block is shown next to each haplotype. The number between two blocks is the Hedrick's multi-allelic D′; D′ >= 0.8 is indicative of strong LD between the blocks. D) Inferred haplotypes and linkages between five haplotype blocks (numbers above the gray shaded area) for the HbSS subjects. The methods and symbols are the same as described in Panel C.