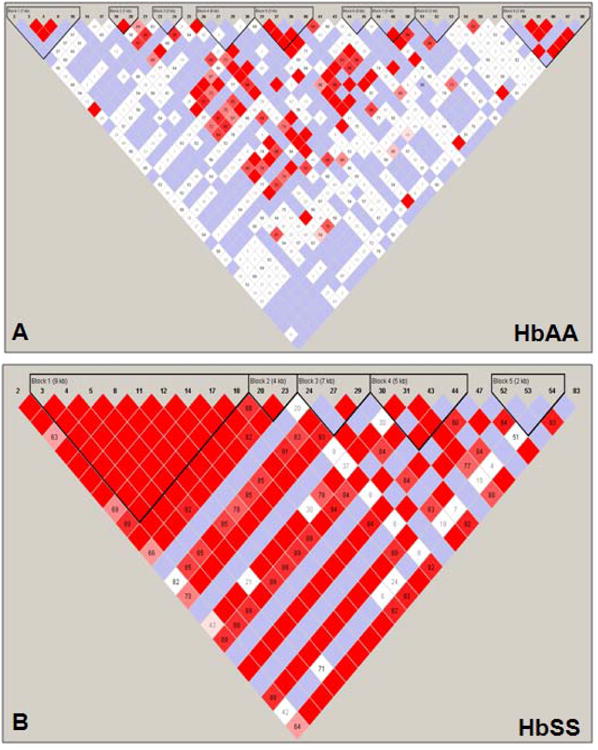
Fig. 4. Linkage Disequilibrium and haplotype block patterns across the β-locus.

A) Shown are the LD patterns and haplotype blocks established by Haploview analysis with the SNP-chip data for the HbAA group. The numbers on top represent the SNPs used for the analysis. Haplotype blocks are shown by inverted triangles. Within each haplotype block, the distance of the region covered is indicated in kilo-bases (kb). The color code is the same as defined in the legend for Fig. 1B. B) The LD patterns and haplotype blocks established by the Haploview analysis with the SNP-chip genotype data for the HbSS group are shown. The symbols are the same as defined in Panel A
