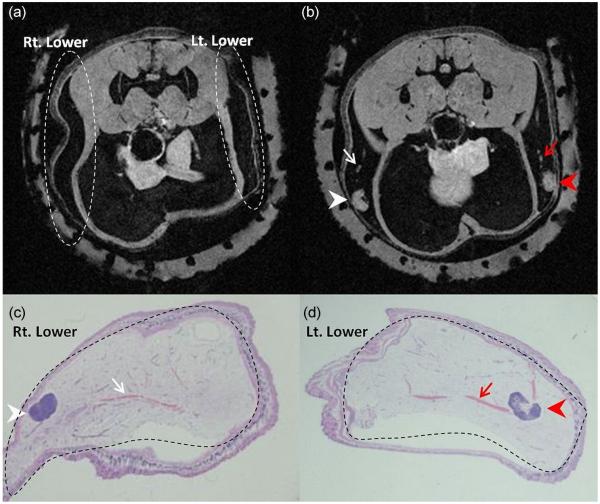
Figure 4.
High-resolution axial screening MR images (a–b) and corresponding histologic sections (c–d) of right (white arrows) and left (red arrows) lower mammary glands from one wild-type FVB/N mouse. Each axial MR image represents only one cross sectional slice through the right and left lower glands, as indicated in (a) by the dashed outlines. Conversely, histologic sections represent the entire glands, as indicated in (c–d) by the dashed outlines. The agar grid, which can be visualized wrapped around the mouse, helps to facilitate correlation of MR images with histology. MR images demonstrate (a) normal mammary gland with no lesion or lymph node, (b) lymph nodes (arrowheads) and large blood vessels (thin arrows). FOV for MR images is ~ 2.25×2.25 cm.

