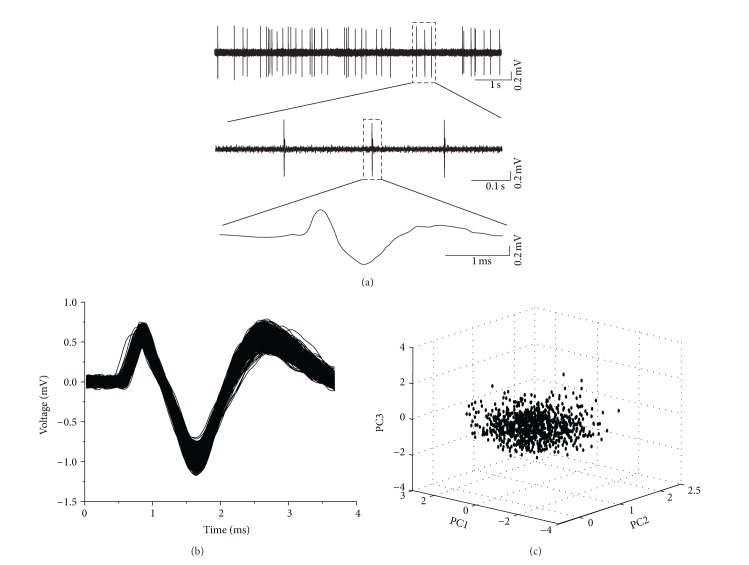
Figure 2.
Recording and sorting of spontaneous discharge of EC neurons. (a) Single unit spontaneous discharge recorded in EC neurons (upper). The lower two panels are the enlargements of the indicated regions in the upper panel. (b) The overdrawn waveforms of firing events during a 30 min period form one cluster, indicating that all of the spikes were from one neuron. (c) Offline classification of spikes with principle component analysis (PCA). Every spike shown in (b) is projected onto the PCA-feature space shown in (c), further indicating that all of the spikes were from one neuron.

