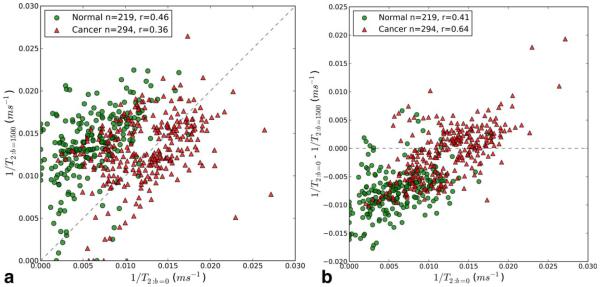
Figure 2.
A: A scatter plot of voxel-wise 1/T2 values estimated from scans at two different b-values. Red triangles are cancer pixels, green circles are normal pixels. The dashed line is the identity line. The number of voxels (n) and the Pearson correlation coefficient (r) are reported in the legend. B: A scatter plot of voxel-wise 1/T2:b=0 versus 1/T2:b=0− 1/T2:b=1500. Red triangles are cancer pixels, green circles are normal pixels. The dashed line is the zero difference line. The number of voxels (n) and the Pearson correlation coefficient (r) are reported in the legend.

