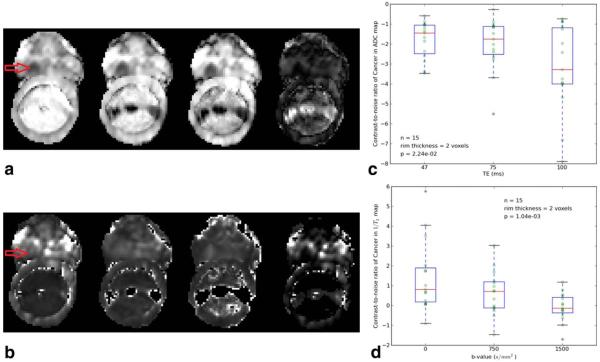
Figure 3.
A: Axial ADC images from a 71-year-old patient with prostate cancer are shown. Images from left to right are: ADC at TE = 47, 75, 100 ms and the absolute value of the difference image: ADCTE=47-ADCTE=100 (arrow points to cancer location: right mid medial, Gleason score 8). Scale is the same for the first three images, and the last image was scaled from 0 to the maximum signal in the difference image. The increased contrast showing the tumor more clearly is evident in ADCTE=100 and the subtraction image. B: Same patient and slice as in Figure 3a is shown. Conventional images of T2 at b=0, 750, 1500 s/mm2 and the absolute value of the subtraction image, T2:b=0−T2:b=1500, are shown. All the images are set to the same scale. Increased contrast appears in the cancer region (right mid medial, Gleason score 8) compared with normal region (right mid lateral) at b=0 and in the subtraction image. The images were scaled identically. C: Boxplot of estimated contrast-to-noise ratio for ADC values in the 15 prostate cancer ROIs, at different TEs. D: Boxplot of contrast-to-noise ratios for 1/T2 values in the 15 prostate cancer ROIs, at different b-values.

