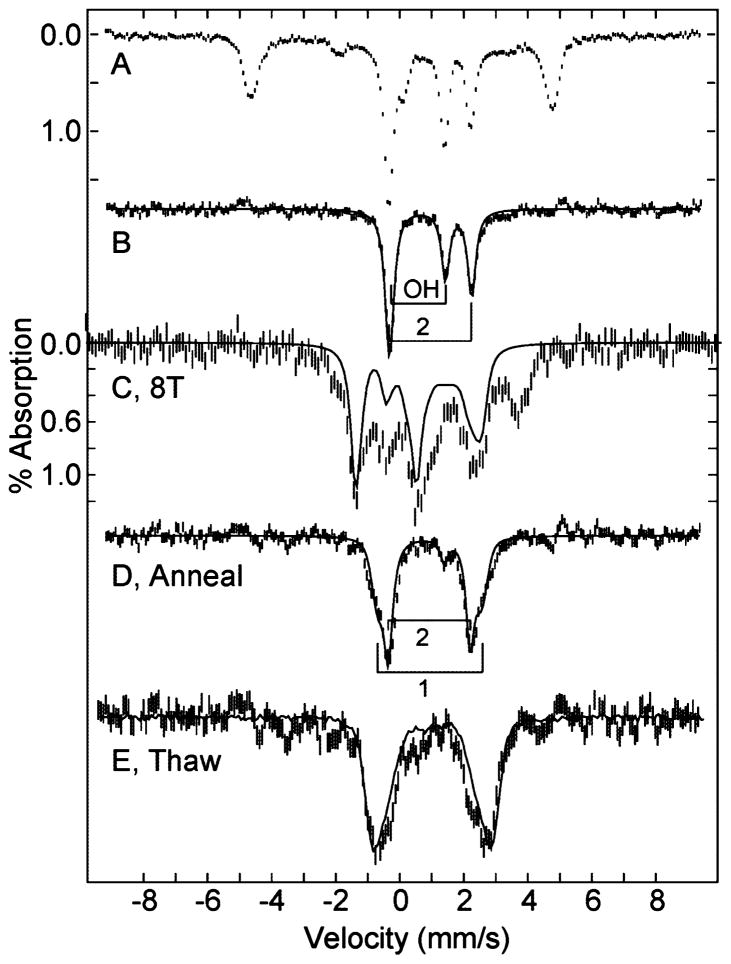
Figure 5.
Mössbauer spectrum after cryoreduction of (A) 1.5 mM oxidized TDO, pH 7.4. The difference spectra (B–E) after subtracting the spectrum of oxidized TDO are: (B) 45 mT; (C) 8 T; (D) after annealing; (E) after thawing, including an overlay (solid line) of the reduced TDO spectrum. All spectra are recorded at 4.2 K and magnetic field of 45 mT parallel to γ-ray direction, except (C). The solid lines in (B) and (D) are least-squares fits for species: (B) o1red-OH (OH), o2red (2); and (D) o1red-anneal (1), o2red-anneal (2). The solid line in (C) is a simulation at 8 T for the S = 0 species o1red-OH. See Table 2 for parameter listings of species.

