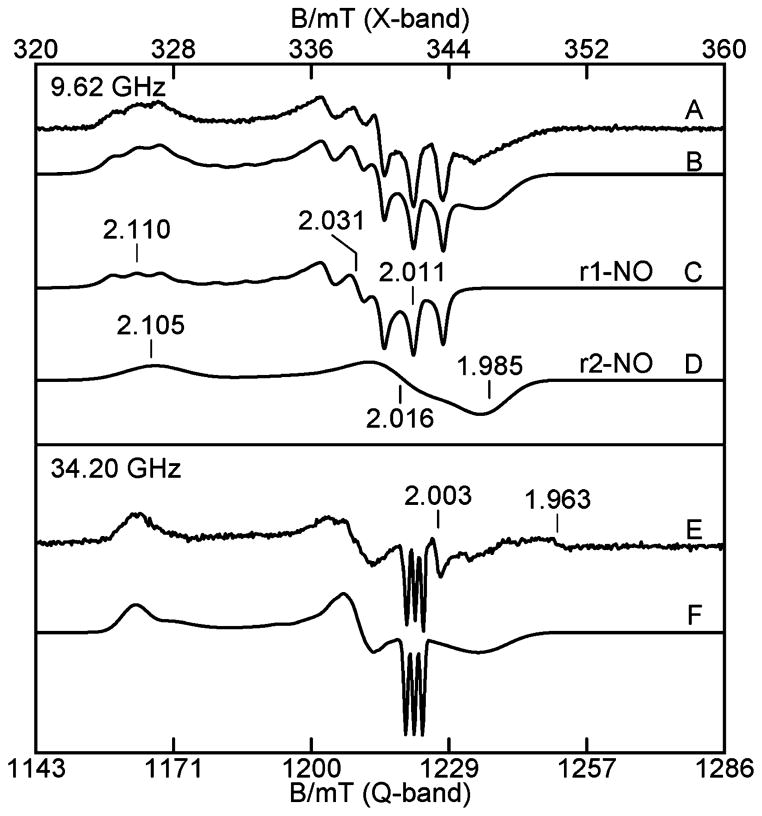
Figure 7.
(A) X- and (E) Q-band EPR spectra of the NO adduct of 0.3 mM reduced TDO without L-Trp. (B) Simulation sum (C) + (D) of the two sites, (C) simulation of r1-NO, (D) simulation of r2-NO, and (F) simulation sum of the two sites of (E). Experimental conditions: microwave frequencies as listed; power, 0.02 mW (X), 0.005 mW (Q); temperature, 20 K (X), 27 K (Q). The simulation parameters are given in Table 1, and σg1 = (0.0015, 0.0032, 0.0044), σg2 = (0.0074, 0.0089, 0.0107). The weak signal near g = 1.96 is due to a minor amount of free NO in solution.

