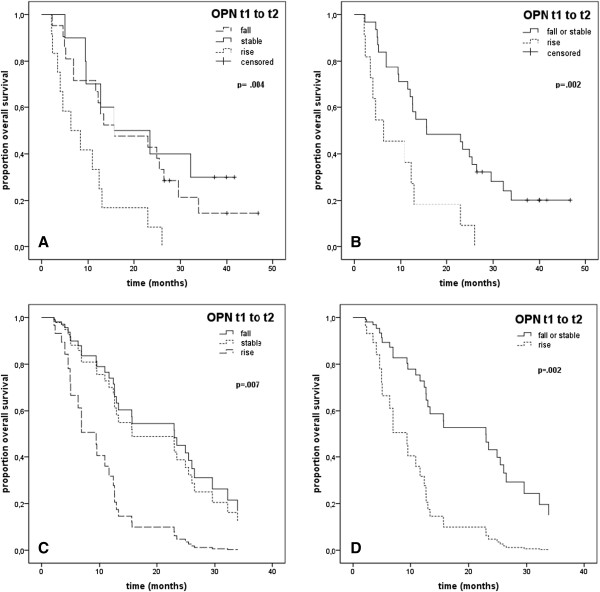
Figure 2.

Overall survival in curative-intent (M0) patients in Kaplan-Meier analysis (A and B) and Cox proportional hazards model (C and D). (A) increasing vs. decreasing vs. stable and (B) increasing vs. decreasing post-treatment OPN levels (t1 to t2), (C) increasing vs. decreasing vs. stable and (D) increasing vs. stable or falling OPN levels after radiotherapy (t1 to t2).
