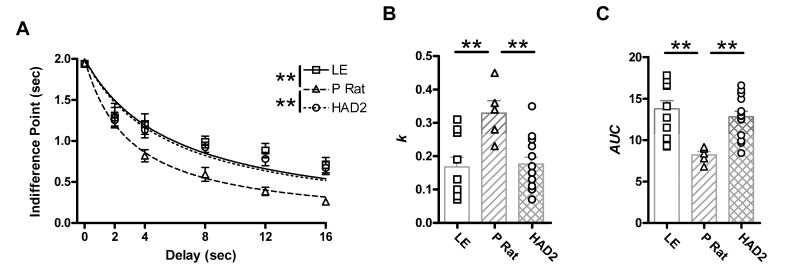
Fig 1.
From the delay discounting paradigm: A) Mean indifference points (±SEM) plotted as a function of delay. The hyperbolic curve is defined by the mean k value; B) k values as a function of strain. Bars correspond to mean values (±SEM). C) Area under the curve (AUC) scores as a function of strain. Bars correspond to mean values (±SEM). ** p <.01 on Fishers LSD test.

