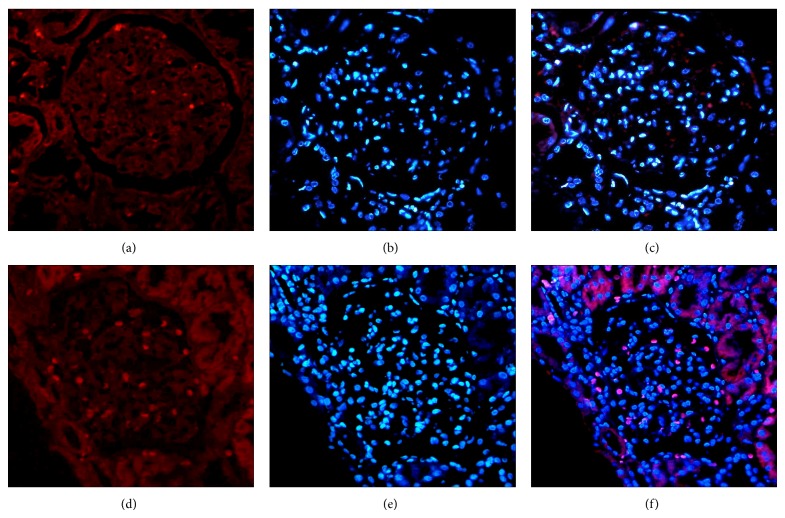
Figure 5.
The expression of mRNA Fas receptor in renal tissue of LN patients and HS by FISH. The upper panel (a), (b), and (c) shows the HS tissue, and the lower panel (d), (e), and (f) shows a representative LN. (a) and (d) Expression of the mRNA Fas receptor (red). (b) and (e) Staining in blue by DAPI. (c) and (f) show the overlapping (pink).

