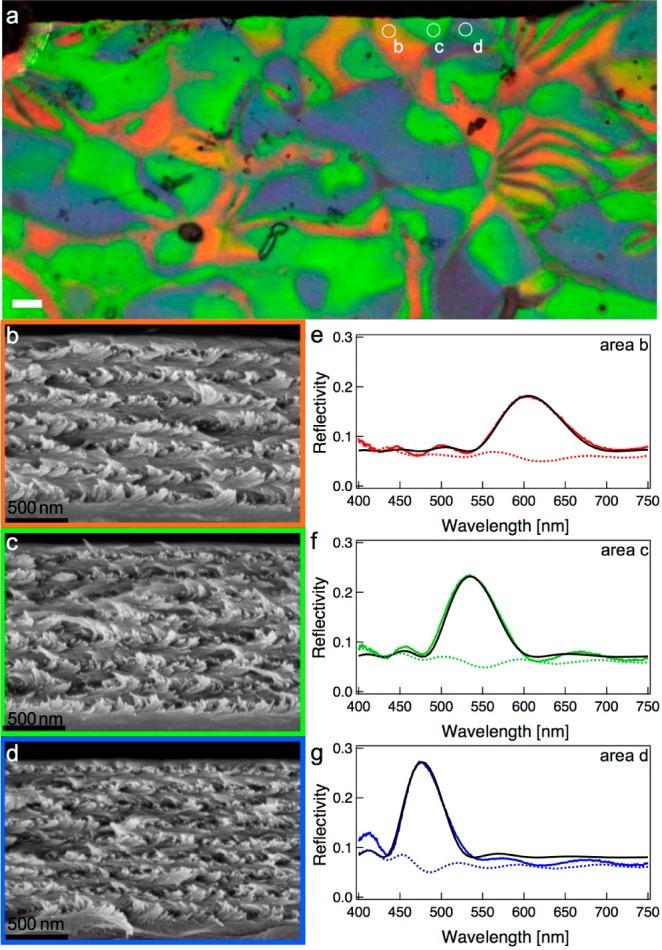
Figure 2.

Correlation of optical and electron microscopy and the reflectance spectra of the different domains. (a) Reflected LCP image zoomed into Figure 1b. The white circles show areas b, c, d from which reflectance spectra and (b–d) cross-sectional SEMs were acquired. (e–g) Corresponding reflectance spectra; the black solid lines are curve fits to the spectra using Berreman’s 4 × 4 matrix method.
