
Figure 6. Expression profile of BMP receptors after BMP4 treatment in PASMCs.
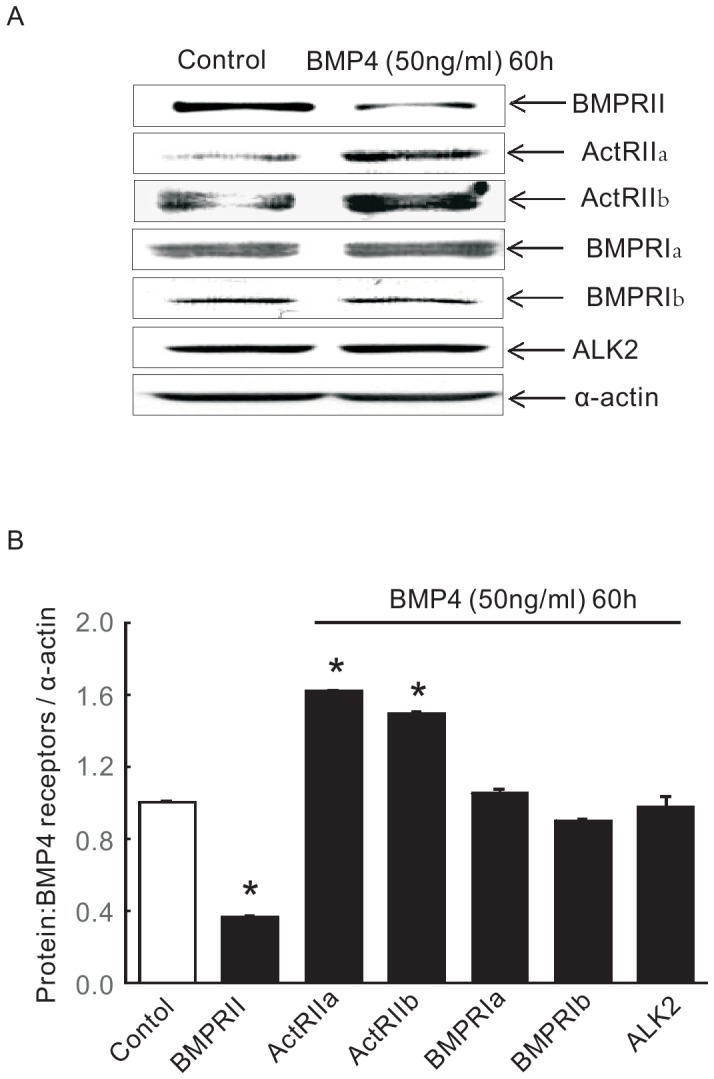
Representative blots (A) and normalized bar graphs (B) of BMPRII, ActRIIa, ActRIIb, ALK2, BMPRIa and BMPRIb protein as detected by Western blotting in PASMCs treated with 50 ng/ml BMP4 for 60 h. Bar graph shows mean protein expression for BMPRII, ActRIIa, ActRIIb, ALK2, BMPRIa and BMPRIb protein relative to α-actin (n = 4 in each group; *P <0.05 vs. vehicle control). Bar values are as means ± SEM.