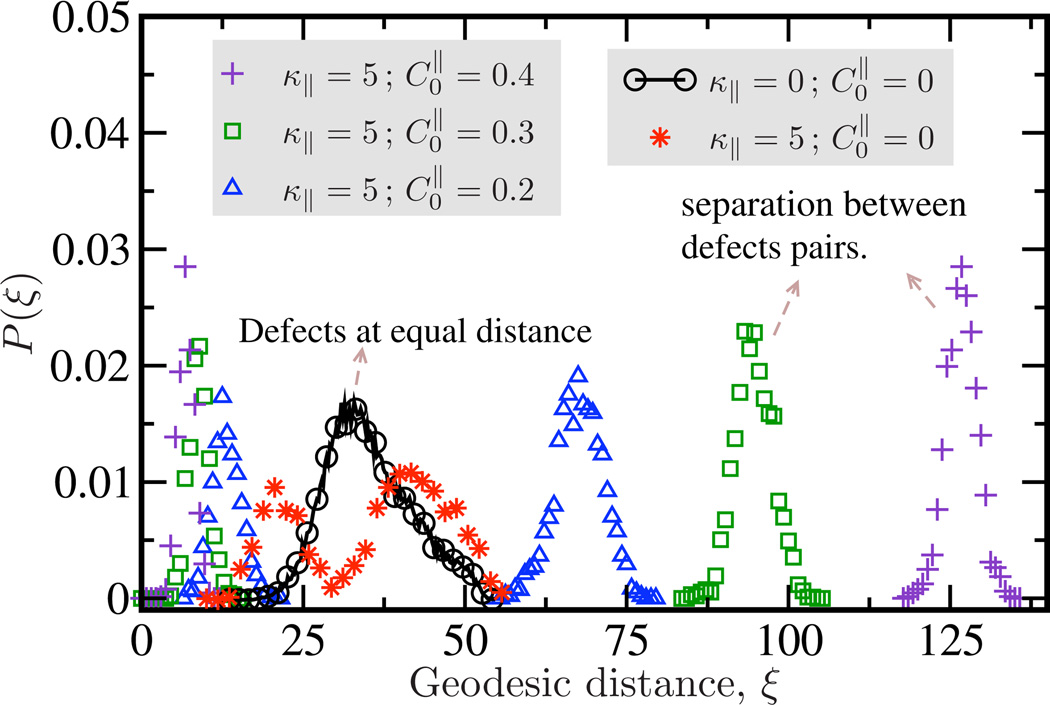
Figure 26.
P(ξ) is the distribution of the geodesic distance between a pair of defect cores, for shapes corresponding to different values of and κ‖ (Reprinted figure with permission from N. Ramakrishnan, John H. Ipsen, P. B. Sunil Kumar, Soft Matter, 8(11), 3058 and 2012. Copyright (2012) by the Royal Society of Chemistry).

