
Figure 4.
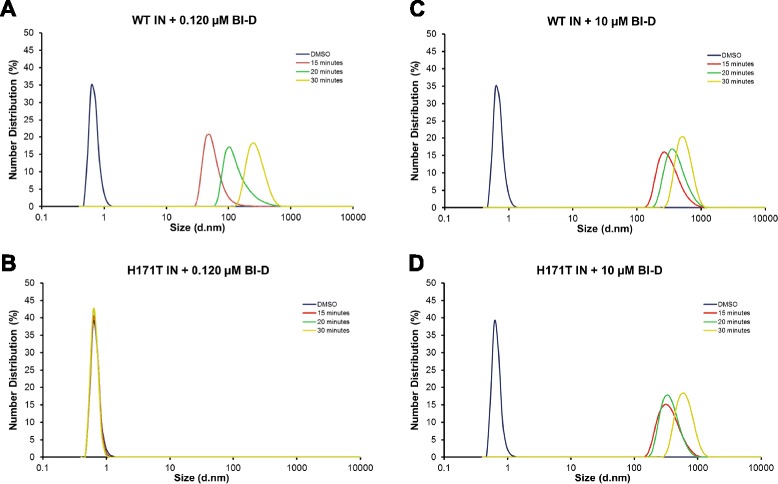
DLS analysis of BI-D induced oligomerization of recombinant WT and the H171T INs. Shown are the size distributions (%) of IN after DMSO treatment (blue) or BI-D treatment after 15 minutes (red), 20 minutes (green) and 30 minutes (yellow) incubation. BI-D treatments include (A) WT IN +0.120 μM BI-D, (B) H171T IN +0.120 μM BI-D, (C) WT IN +10 μM BI-D and (D) H171T IN +10 μM BI-D. The peak with the diameter size of <1 nm detected in these samples has also been observed for the buffer alone sample indicating that small size particles unrelated to IN or BI-D were present in our preparations.