
Figure 2.
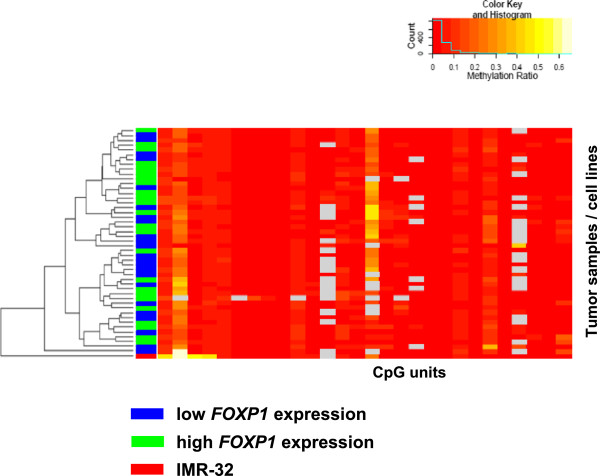
Hierarchical clustering of FOXP1 DNA methylation ratios. A total of 45 CpG units of FOXP1 were analyzed in 47 tumor samples and the neuroblastoma cell line IMR-32 (indicated in red). FOXP1 expression levels of the tumors (blue, low; green, high; as defined by the expression cutoff value for dichotomizing patient EFS) are indicated aside. DNA methylation values are indicated by colors ranging from dark red (non-methylated) to bright yellow (65% methylated). Poor quality data are indicated in grey. A histogram is given in the inset that indicates the frequency of each color in the hierarchical clustering.