
Figure 8.
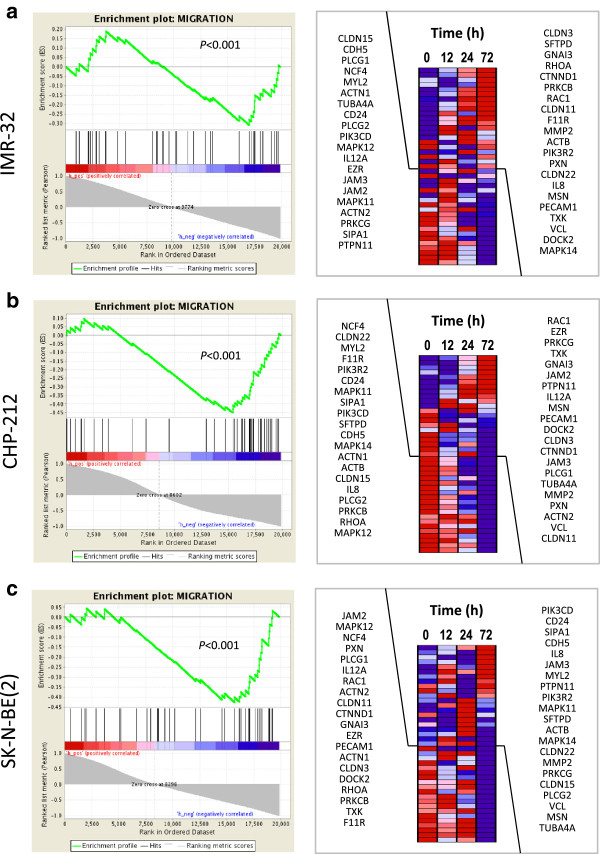
FOXP1 down-regulates genes involved in migration. Gene set enrichment analysis (GSEA) of time-resolved gene expression measurements in FoxP1-induced neuroblastoma cells. Cells were analyzed 0, 12, 24 and 72 hours after transgene induction. The enrichment score (ES) plotted as a function of the position within the ranked list of array probes is shown as a green line. The ranked list metric shown in gray illustrates the correlation of the gene expression values across the time series. Right, individual expression profiles for time leading edge probe sets contributing to the normalized enrichment score are shown. Signal intensities are illustrated by varying shades of red (up-regulation) and blue (down-regulation). FoxP1 decreases the expression of genes involved in migration processes in (a) IMR-32, (b) CHP-212 and (c) SK-N-BE (2) cells as compared to GFP-expressing controls.