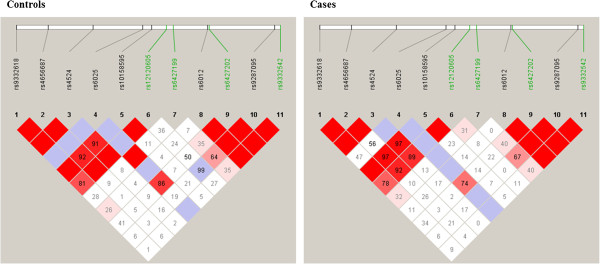
Figure 1.

Linkage disequilibrium (LD) plots of the F5 SNPs. Linkage disequilibrium (LD) plots of the 11 analyzed SNPs including factor V Leiden (rs6025), within the F5 gene for controls (left plot) and cases (right plot). The LD measure D’ is shown. The disease associated SNPs are depicted in green.
