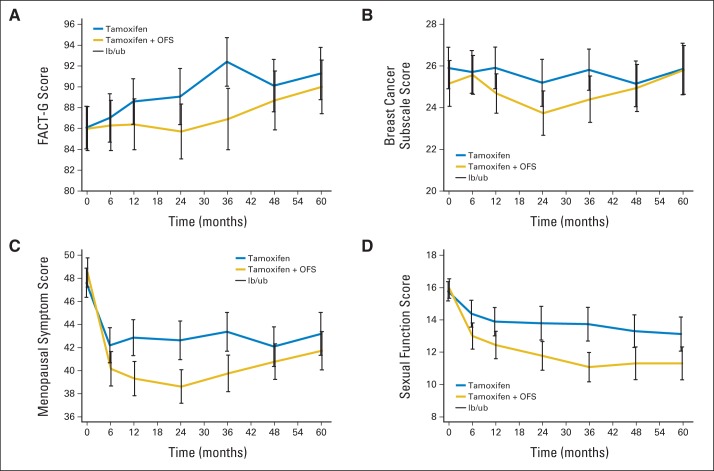
Fig 3.
Patient-reported outcome scores for (A) Functional Assessment of Cancer Therapy-General (FACT-G), (B) breast cancer subscale, (C) menopause symptom, and (D) sexual function assessments and 95% CIs over time by treatment arm in analyzable patients. Vertical lines represent 95% CIs. lb/ub, lower border/upper border; OFS, ovarian function suppression.

