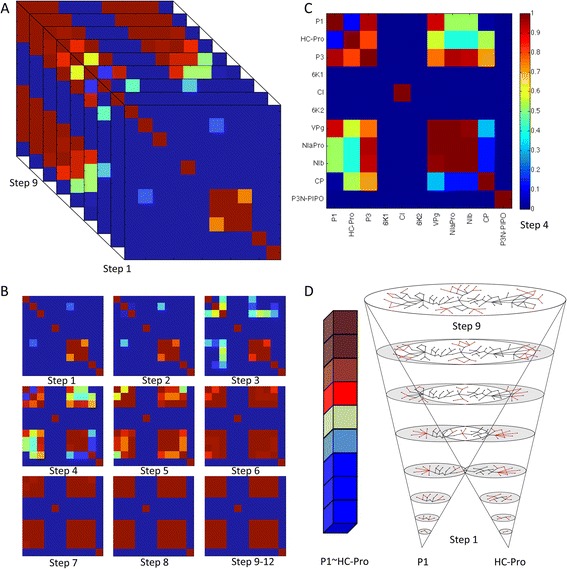
Figure 8.

Voxel representation of the Simpson index. (A) Voxel representation of the Simpson index for the viral proteins across the HHPIN. (B) Consecutive pixel representations of the SI for the twelve steps that form the HHPIN. (C) Pixel representation for step 4. Viral proteins are shown in X and Y axes and relevance coefficient color legend is displayed on the right side vertical axis. (D) Evolution of the SI for the P1 ~ HC-Pro interaction across the entire HHPIN. A schematic cone of possible interactions is displayed as well to visually represent the networks growing from the viral proteins (step 1) until the end of the HHPIN.
