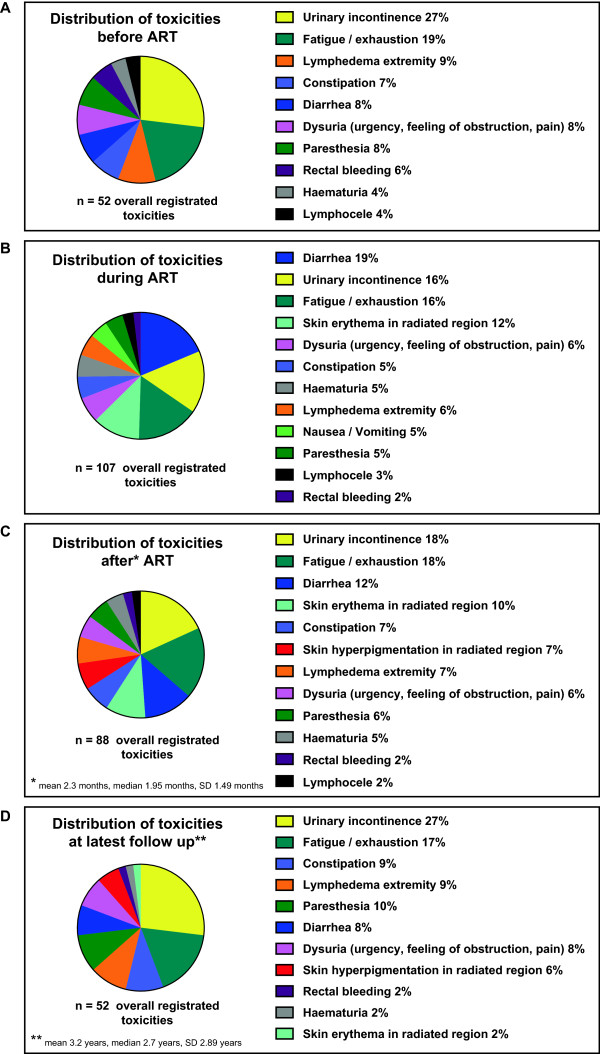
Figure 4.

Distribution (n, %) of overall recorded toxicities at different time points: A) before, B) during, C) after and D) at latest follow up from 46 radiotherapies. The coloured panels reflect the percentage distribution of adverse events at different time points regardless of the CTCAE-grading.
