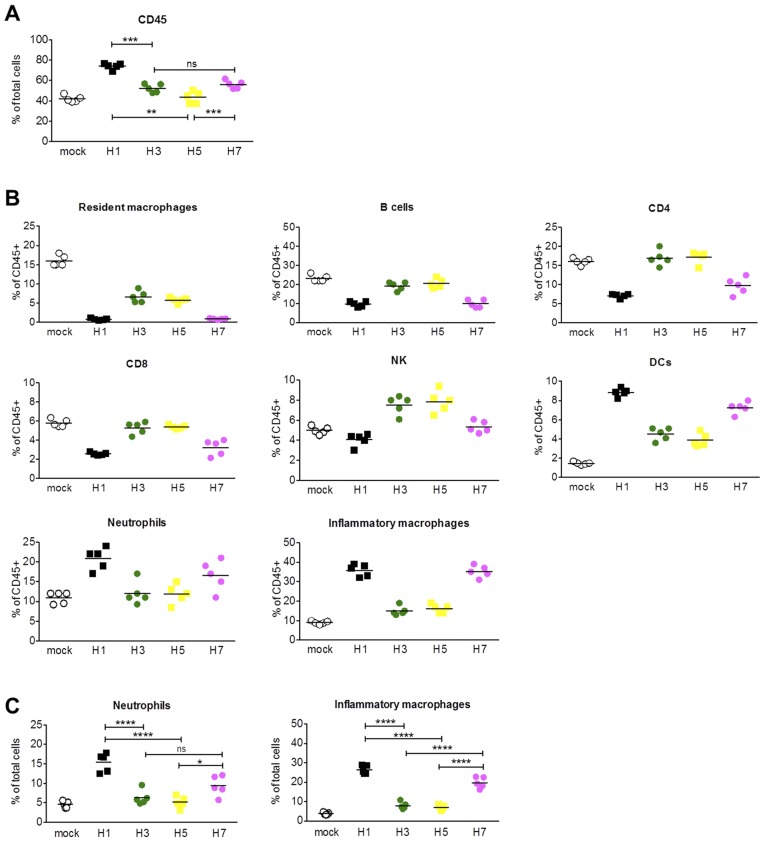
FIG 3 .
Immunophenotypic analysis of lung CD45+ cells following infection with chimeric avian influenza viruses, at 6 days p.i. (A) Percentage of lung cells that were CD45+ at 6 days p.i. following infection with the H1, H3, H5, and H7 viruses, compared to those for mock-infected animals. H1, H3, and H7 infections resulted in a statistically significant increase in CD45+ cells compared to mock infection. (B) Percentage of lung CD45+ cells by immune cell phenotype. Mature DCs H1 versus H3, P = 0.0005; H1 versus H5, P = 0.0002; H7 versus H3, P = 0.0109; H7 versus H5, P = 0.0042. (C) Total percentage of neutrophils and activated macrophages. Both neutrophils and inflammatory macrophages were present in significantly higher percentages in the lungs from the pathogenic H1 and H7 infections than in those from the less pathogenic H3 and H5 infections. For neutrophils: H1 versus H3, P < 0.0001; H1 versus H5, P < 0.0001; H7 versus H3, P = 0.1415; H7 versus H5, P = 0.0226. For inflammatory macrophages: H1 versus H3, P < 0.0001; H1 versus H5, P < 0.0001; H7 versus H3, P < 0.0001; H7 versus H5, P < 0.0001.

