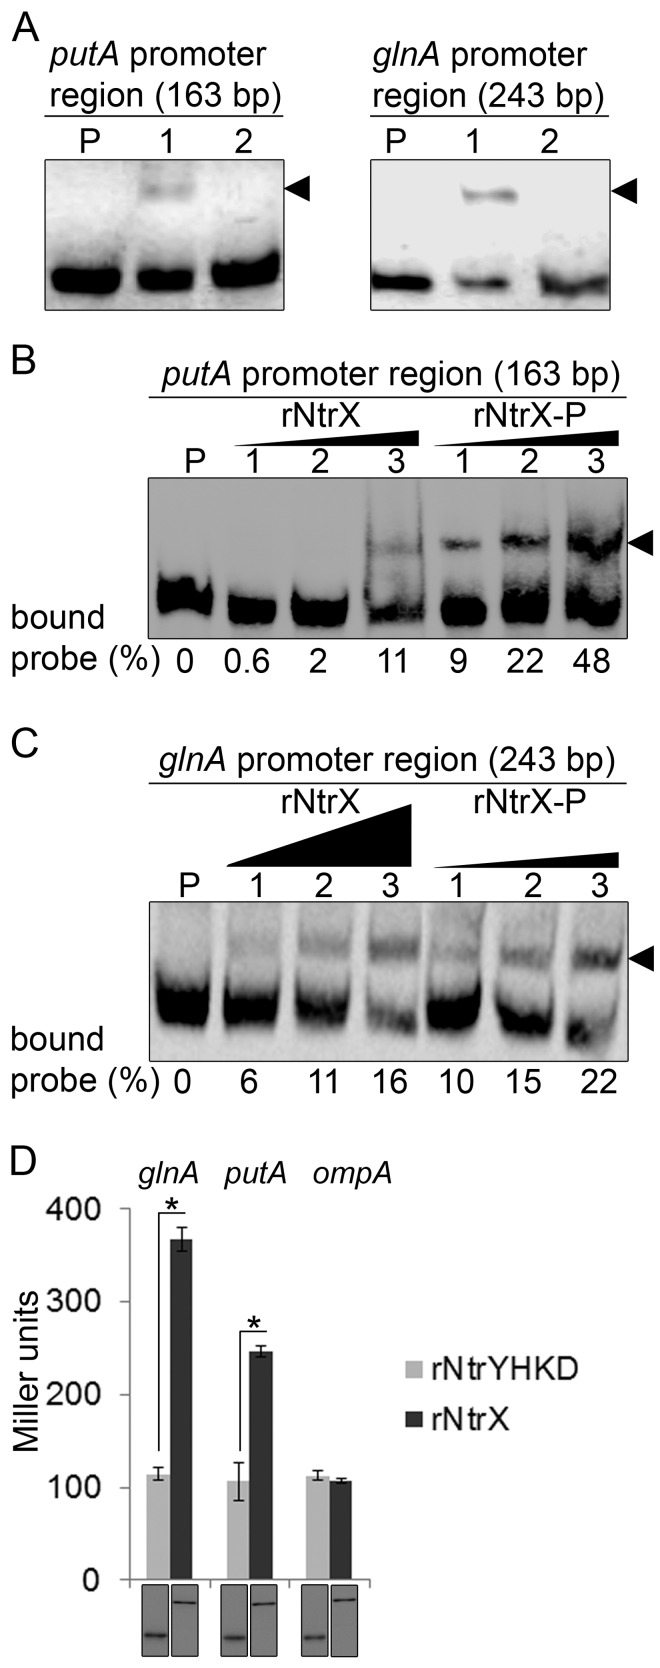
FIG 6 .
NtrX regulates putA and glnA expression. (A) EMSA for rNtrX binding to the promoter regions of putA (left) and glnA (right). The length (bp) of the probe is shown above each panel. For each panel, biotinylated DNA probe (2 nM) was incubated alone (P), with rNtrX (10 nM, lane 1), or with rNtrX in the presence of 50-fold excess of the corresponding unlabeled DNA competitor (lane 2). Shifted bands are indicated by arrowheads. (B) EMSA for dose-dependent binding of rNtrX and rNtrX-P to the putA promoter. Biotinylated DNA probe (2 nM) was incubated alone (P) or with rNtrX or rNtrX-P at different concentrations (lanes 1 to 3: 2, 4, and 8 nM, respectively). Shifted bands are indicated by an arrowhead. Black triangles show proportions of protein amounts. The numbers below the panel indicate the percentage of bound probe with respect to the total of each lane. (C) EMSA for dose-dependent binding of rNtrX and rNtrX-P to the glnA promoter. Biotinylated DNA probe (2 nM) was incubated alone (P) or with rNtrX at different concentrations (lanes 1 to 3: 6, 20, and 60 nM, respectively) or with rNtrX-P at different concentrations (lanes 1 to 3: 1.5, 5, and 15 nM, respectively). Shifted bands are indicated by an arrowhead. Black triangles show proportions of protein amounts. The numbers below the panel indicate the percentage of bound probe with respect to the total of each lane. (D) NtrX transactivates glnA and putA promoter-lacZ fusions in E. coli. E. coli strains containing pET-33b(+) encoding rNtrX and rNtrYHKD were transformed with the glnA-, putA-, or ompA-lacZ fusions containing the promoter regions of glnA (243 bp), putA (163 bp), or ompA (368 bp), respectively. After induction of rNtrX or rNtrYHKD with IPTG, β-galactosidase activity was measured. Top, β-galactosidase activity (Miller units). Data indicate the means ± standard deviations from three independent experiments performed in triplicate. *, significantly different (P < 0.05) by Student’s t test. Bottom, Western blot analysis of samples from the β-galactosidase assays was performed using a monoclonal antibody against the His tag to verify the expression of rNtrX and rNtrYHKD. A representative of three independent experiments is shown. Each lane received 1 µg protein.

