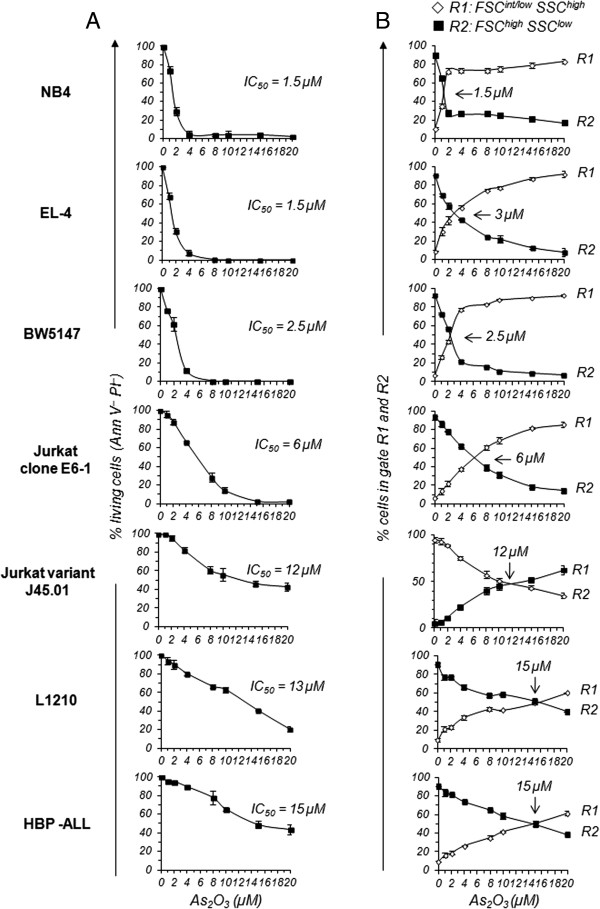
Figure 1.

Viability and cell morphology of various T-cell lines cells upon As 2 O 3 -treatment. (A) APL-derived NB4 cells as well EL-4, BW5147, L1210, Jurkat (clone E6-1), CD45-deficient Jurkat variant (J45.01) and HPB-ALL T-cell lines were treated with As2O3 for 24 h with doses ranging from 1 to 20 μM. T-cell lines were then stained with Annexin V and PI, and the percentages of living cells (Ann V- PI-) determined by flow cytometry. At least 20,000 events were analyzed for each sample. Graphs show mean percentages ± SE of Ann V- PI- cells from more than 4 independent experiments. IC50 in the graphs indicates the concentration of As2O3 that kills 50% of the cells. (B) Cells were analyzed by flow cytometry with respect to size (FSC) and granulosity (SSC). Regions R1 and R2 identified on a FSC vs. SSC dot plot encompassed cells with FSCintermediate(int)/lowSSChigh and FSChighSSClow, respectively. At least 20,000 events were analyzed for each sample. Graphs show mean percentages ± SE of cells located in region R1 (◊) and R2 (■) at the indicated concentration of As2O3. Numbers in the graphs indicate the concentration of As2O3 at which 50% of the cells shifted from region R2 to region R1. Four independent experiments were performed for NB4 and J45.01 cells, and more than 10 for EL-4, BW5147, L1210, Jurkat and HPB-ALL cells.
