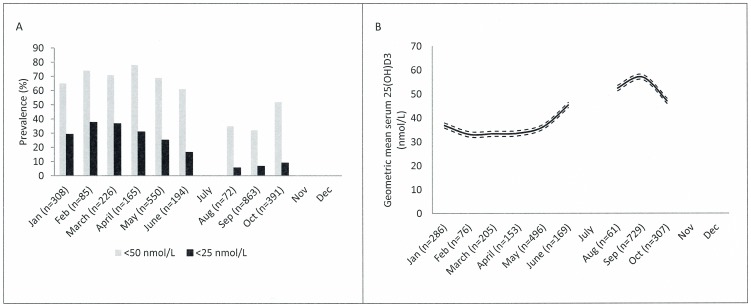
Figure 3. Seasonal variation in vitamin D.
(A) Seasonal variation in vitamin D insufficiency (<50 nmol/L) and deficiency (<25 nmol/L) measured as serum 25(OH)D3 among 2854 adults included in the IHIT study, 2005–2010, and (B) geometric mean serum 25(OH)D3 concentration (nmol/L) with 95% confidence interval by month after adjustment for age, gender and intake of traditional food among 2482 adults included in the IHIT study, 2005–2010.

