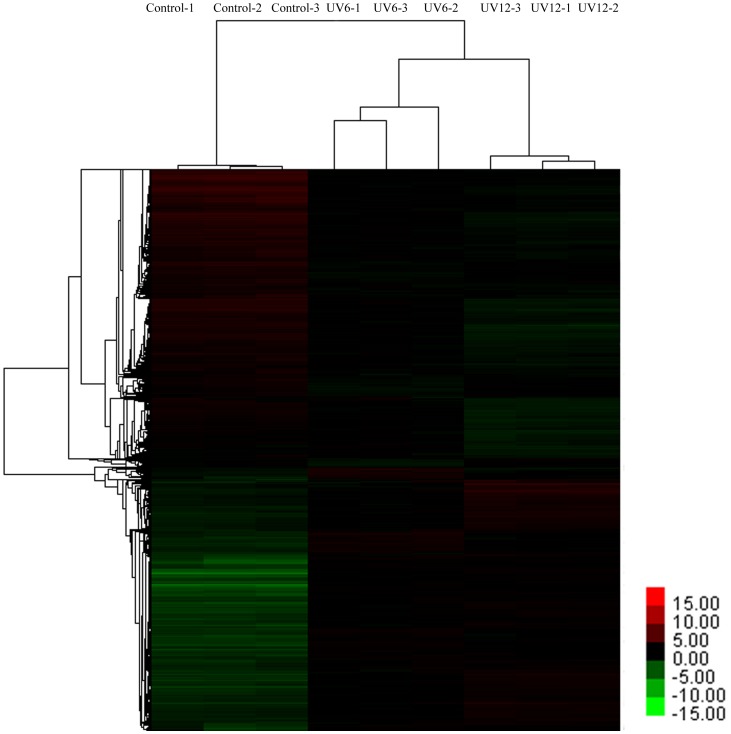
Figure 1. Average linkage hierarchical clustering analysis of the log2 signal values of the 5274 DE probe sets after UV-C.
Control-1, control-2, and control-3 are three replications before UV-C treatment; UV6-1, UV6-2, and UV6-3 are three replications 6 h after UV-C treatment; UV12-1, UV12-2, and UV12-3 are three replications 12 h after UV-C treatment.

