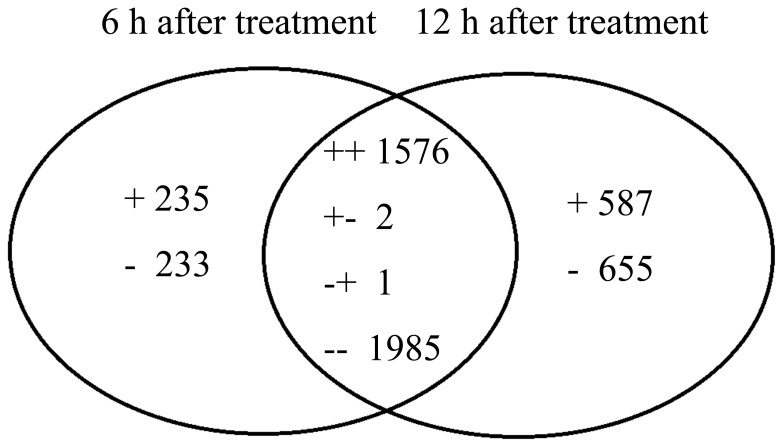
Figure 2. Venn diagram of differentially expressed transcripts (both identified and unknown) that were up- and down-regulated 6 and 12 h after UV-C treatment.
The symbols “+” and “−” indicate up- and down-regulated transcripts. A total of 5274 transcripts were significantly (P<0.05) affected by UV-C treatment. There were 235 unique up-regulated transcripts 6 h after UV-C treatment; 587 unique up-regulated transcripts 12 h after UV-C treatment; 233 unique down-regulated transcripts 6 h after UV-C treatment; 655 unique down-regulated transcripts 12 h after UV-C treatment; 1576 transcripts were up-regulated both 6 and 12 h after UV-C treatment; 1985 transcripts were down-regulated both 6 and 12 h after UV-C treatment; 2 transcripts were up-regulated 6 h after UV-C treatment but down-regulated 12 h after UV-C treatment; 1 was down-regulated 6 h after UV-C treatment but up-regulated 12 h after UV-C treatment.

