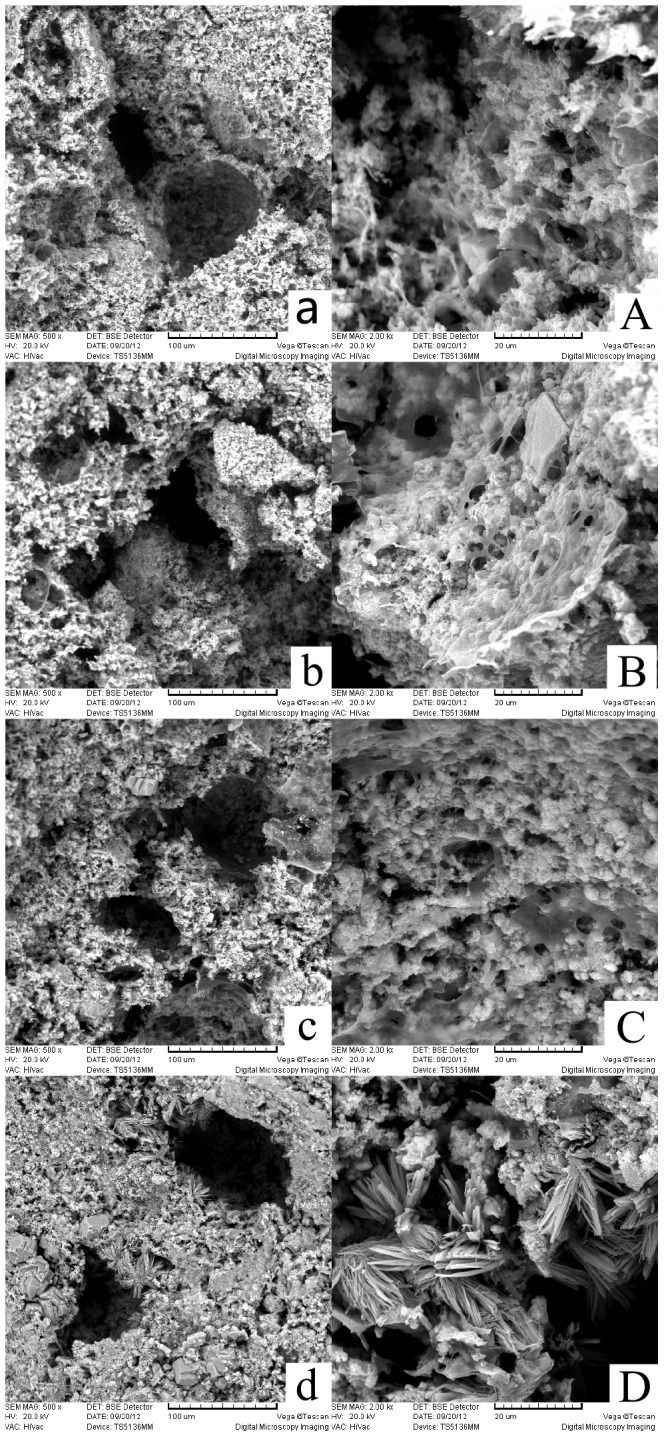
Figure 2. Fracture surface micromorphology of lysostaphin-loaded cement samples.

Fig. 2 a-d (500× amplification) show the fracture surfaces of cement samples a-d. Fig. 2 A-D (2000× amplification) are enlarged images of Fig. 2 a-d. a is cement sample allowed to set for 0.5 h; b is cement sample allowed to set for 1 h; c is cement sample allowed to set for 2 h; d is cement sample allowed to set for 4 h.
