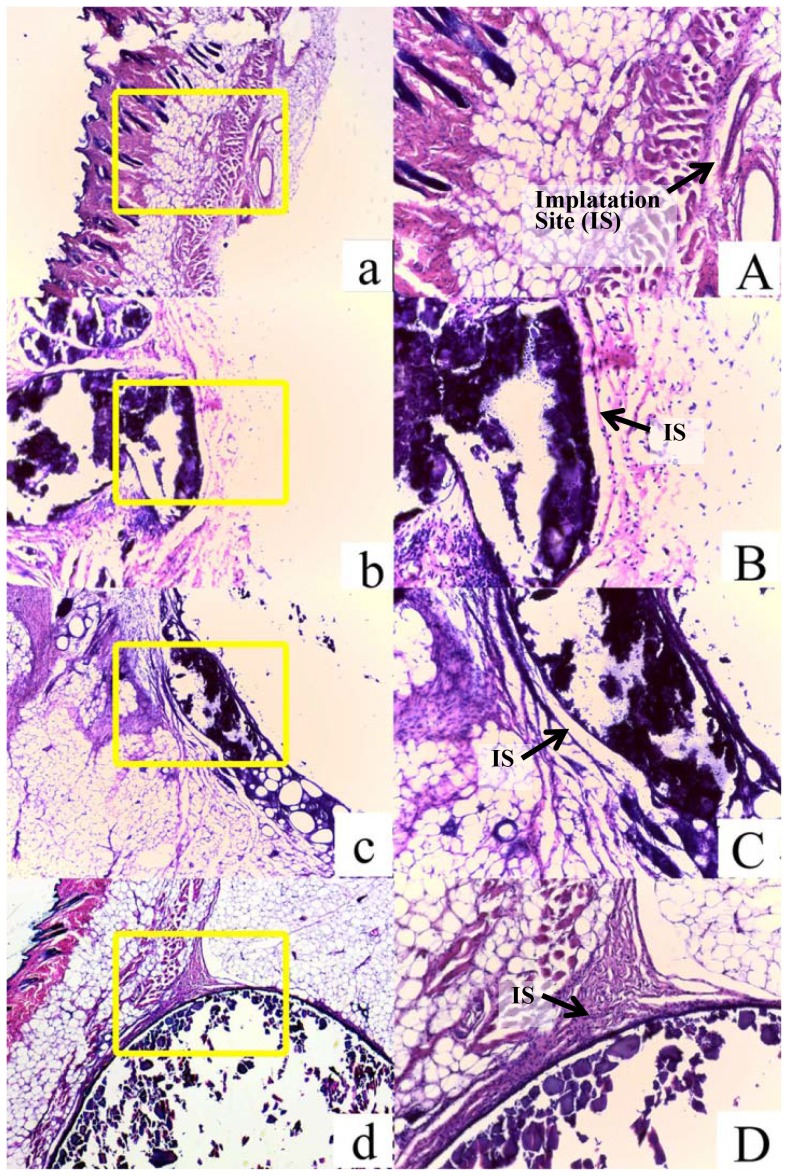
Figure 9. Light micrographs of tissue responses to normal saline (a & A), HA/CS composite (b & B), non-lysostaphin cement sample (c & C) and lysostaphin-loaded cement sample (d & D) with HE staining at 6 weeks after subcutaneous injection in ICR mice.
Fig. 9 a-d: 40× amplification; Fig. 9 A-D: 100× amplification.

