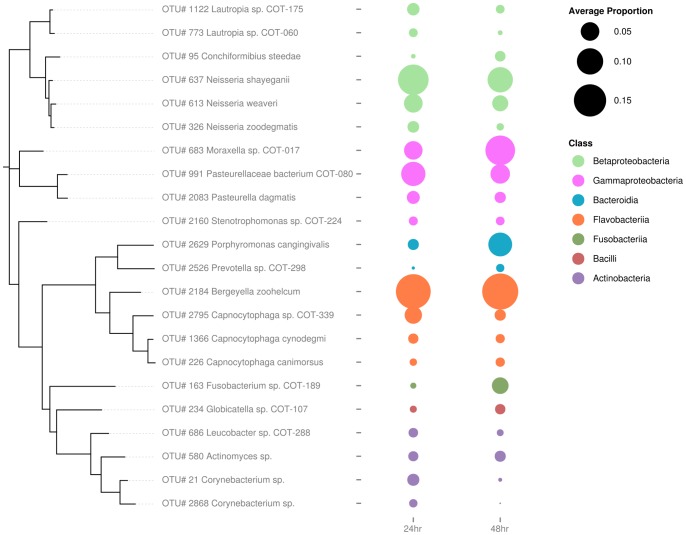
Figure 2. Relative abundances of the 22 dominant OTUs in sub-gingival plaque samples at 24 and 48 hours.
Shown are all OTUs with at least 1% average abundance at either time point. OTUs were annotated against the Canine Oral Microbiome Database [10] and Silva SSU [22], [23] and a maximum likelihood tree was inferred to illustrate relatedness.

