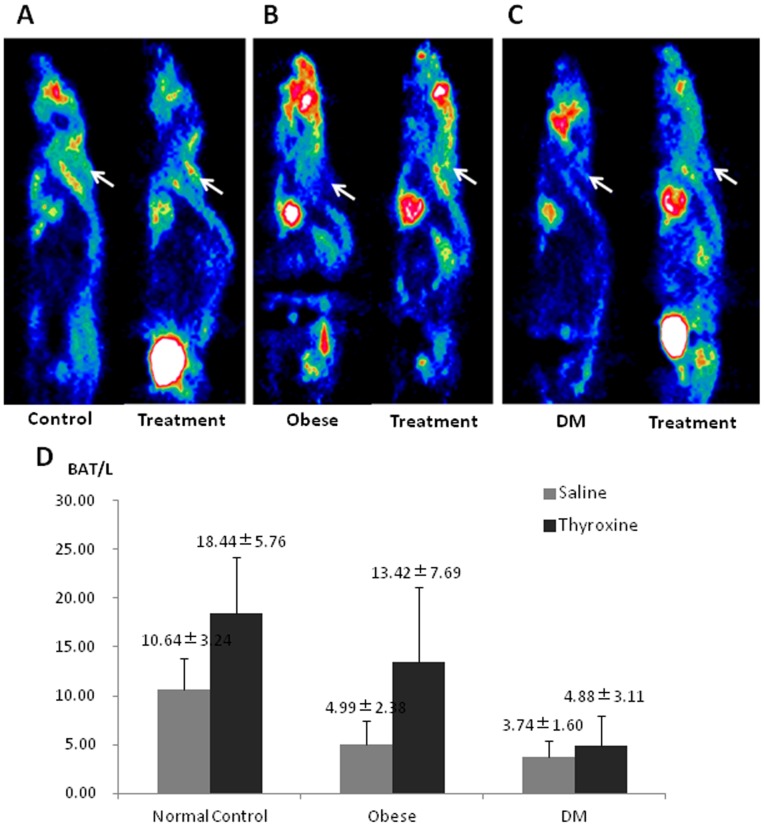
Figure 3. Comparison of brown adipose tissue (BAT) 18F-FDG uptake in the normal, obese, and diabetes mellitus (DM) mice underwent levothyroxine treatment.
A, B, and C: Typical microPET images, with the arrows showing the interscapular BAT uptake of 18F-FDG in the mice. D: Semi-quantitative analysis of BAT-to-liver uptake ratio (BAT/L) showed that after two-week levothyroxine treatment, the BAT/L in the normal and obese mice were significantly increased compared to the corresponding controls (P = 0.025 and 0.013, respectively), whereas the increase of BAT/L in the DM mice was not significant (P = 0.450).

