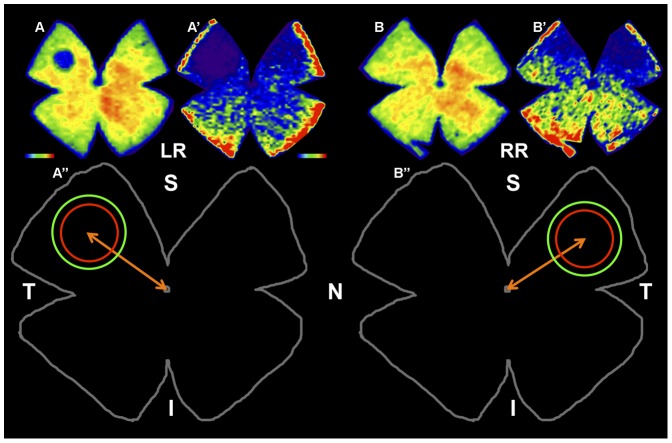
Figure 2. Predetermined fixed-size circular areas (PCA) to count L- or S-cones in left experimental (LR) and right (RR) retinas.
A,A′,B,B′. Isodensity maps of a representative left retina (LR) exposed to blue-light emitting diode induced phototoxicity (LIP) in the left eye and its fellow right retina (RR). Seven days after LIP the retinas were dissected as flattened wholemounts and processed for L- and S-opsin immunohistofluorescence. Isodensity maps were represented as a filled contour plot generated by assigning to each one of the subdivisions of each individual frame a color code according to its L- or S-cone density value within a color-scale range from 0 (purple) to 6,500 or higher L-cones/mm2 (red), or from 0 (purple) to 1,300 or higher S-cones/mm2 (red). Note the presence in the light exposed left retina (LR) of a small circular region of decreased cone density located in the superotemporal quadrant, which is greater for the S- (A′) than for the L-opsin immunoreactivity (A), and the absence of a noticeable lesion in the fellow right retinas (B,B′). A″, B″. Outlines of the retinas shown above to illustrate that L- or S-cone immunopositive outer segments were counted within a predetermined fixed-size circular area (PCA) centred on the lesion with a radius of 1 mm for L- (red) and 1.3 mm for S-cones (green), in the left retina (A″) and in its corresponding location on the right retina (B″). S, superior; T, temporal; I, inferior; N, nasal. Bar = 1 µm.

