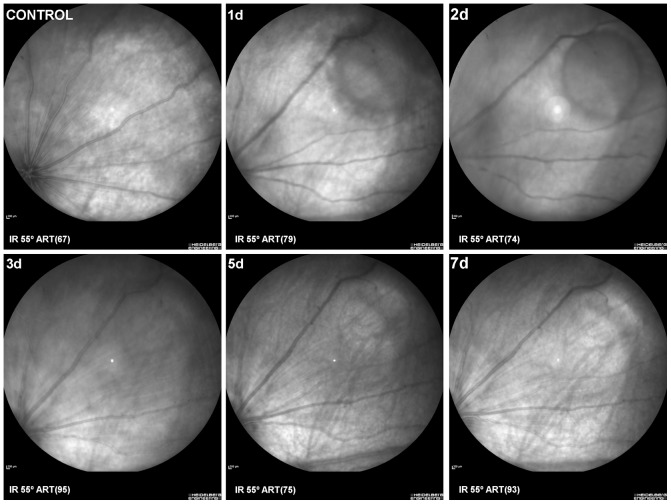
Figure 3. SD-OCT-eye fundus image showing in vivo the evolution of the retinal damage.
Fundus eyes images of a control naïve retina (Control) and an experimental retina to illustrate the location within the retina with respect to the optic disc as well as the progression of damage throughout the time period of the study, from 1 to 7 days after blue-light emission diode induced phototoxicity. IR: Infrared mode. ART: number of frames averaged.

