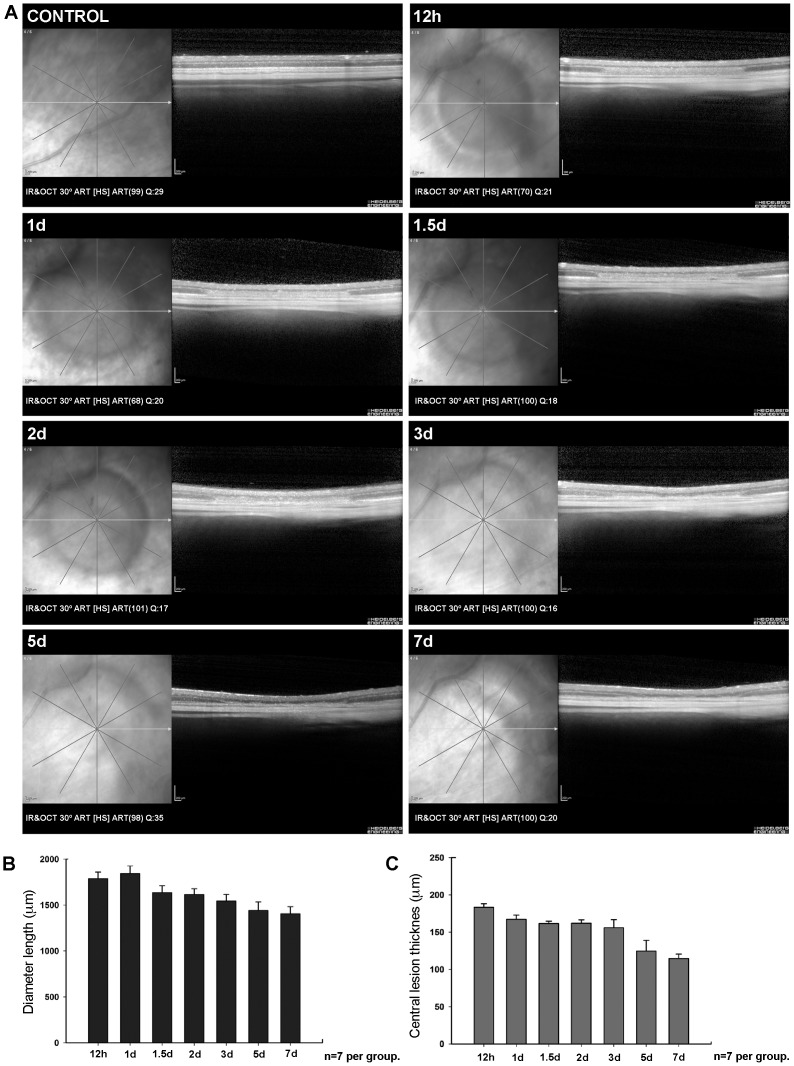
Figure 4. SD-OCT analysis showing the in vivo progression of LIP in one animal.
Fundus eyes images and SD-OCT corresponding scans showing a control retina and one experimental eye at increasing survival intervals (12 hours-7days) after blue-light emitting diode induced retinal phototoxicity in a representative left retina (same retina as shown in Fig.3). The histograms show the diameter of the damaged region (B) and the retinal thickness in the centre of the lesion area (C). A. Retinal damage was circumscribed to a circular region of approximately 1.8 mm diameter within the superotemporal quadrant (the region with highest L-cone densities). B,C. Histograms show analysis of diameter (B) and retinal thickness in the central lesion area (C). B. The length of maximal diameter of the lesion decreased from 24 hours (1,842.4±84.5 µm) to 7 days (1,407.7±52.8 µm) after LIP. C. There was progressive diminution of the retinal thickness in the centre of the damaged region from 12 hours (183.4±5 µm) to 7 days (114.6±6 µm). IR: Infrared mode. OCT: Optical Coherence Tomography mode. HS: High speed. ART: number of frames averaged. Q: quality of image on a scale of 1–50.

