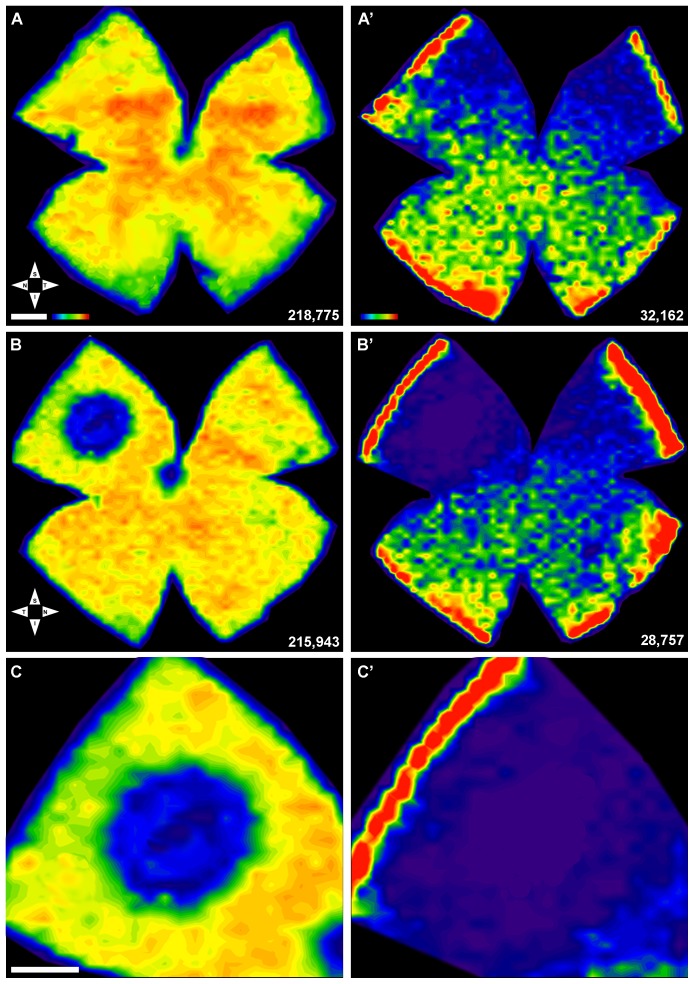
Figure 6. Topography of L- and S-cones in control and damaged retinas.
Isodensity maps illustrating the topological distribution of L- (A,D,C) and S- (A′,B′,C′) cones in right control (unexposed) (A,A′) and the left (light exposed) (B,B′) retinas from a representative retina (same as shown in Fig.5) seven days after LIP. The maps are filled contour plots generated by assigning to each frame a color code according to its cone density value within a color-scale range from 0 (purple) to 6,500 or more (red) L-cones/mm2, or to 1,300 or more (red) S-cones/mm2. A,A′. In the control retina, L- (A) and S-cones (A′) are normally distributed throughout the retina, with highest concentrations of L-cones along the naso-temporal axis in the dorsal retina with maximum values in the superotemporal quadrant, while highest S-cones densities appear in the retinal rims and in the inferotemporal quadrant. B,B′. In contrast, the isodensity map of the light exposed retina (same retina illustrated in Figs. 5B,B′), demonstrates a small circular region with reduced densities of L- (B) and S-cones (B′) in the superotemporal quadrant at approximately 3.4 mm from the optic disc. Note that the area is larger for the S- (B′) than for the L-(A′) opsin. C,C′ magnifications of the superior-temporal quadrant shown in B and B′, respectively to illustrate the region lacking immunostaining of cone outer segments. Bottom right of each map: A,A′,B,B′. Total number of cones counted in that retina. S, superior; T, temporal; I, inferior; N, nasal. Bar: 1 mm.

