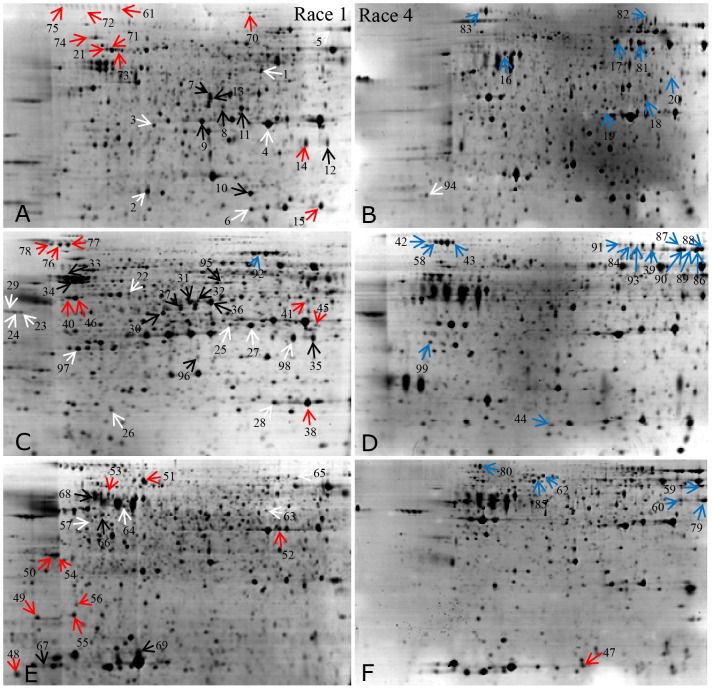
Figure 2. Representative 2-DE profiles of proteins extracted from F1 and F4.
The typical 2-DE profiles of proteins extracted from mycelia of F1 cultured for 2 days (A), F4 cultured for 2 days (B), F1 cultured for 4 days (C), F4 cultured for 4 days (D), F1 cultured for 6 days (E), and F4 cultured for 6 days (F). The 99 differentially expressed proteins are marked with arrows and numbers, white arrows represent proteins up-regulated in F1, red arrows represent proteins specific expressed in F1, black arrows represent proteins up-regulated in F4, blue arrows represent proteins specific expressed in F4.

