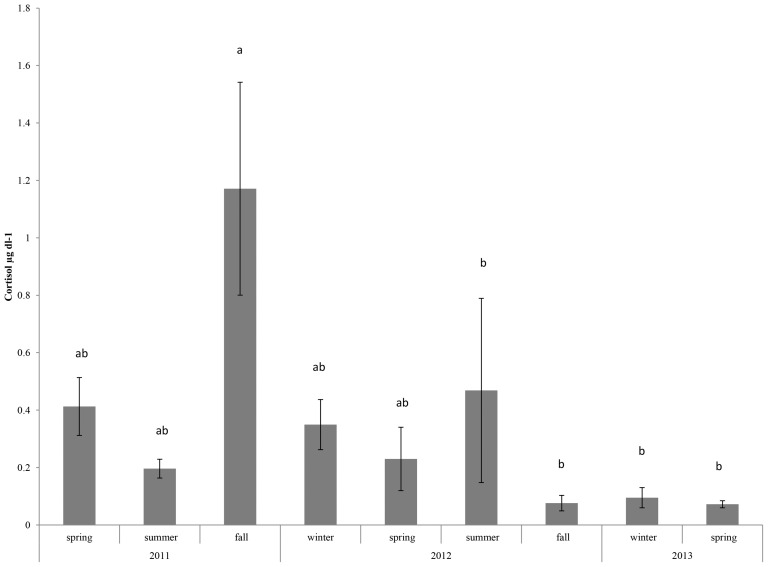
Figure 7. Average cortisol concentrations in blow (± SE) binned by season for 2011, 2012 and 2013.
Letters indicate similarities and differences between seasons (i.e. all seasons marked with an ‘a’ are similar, but differ from those marked with a ‘b’). Cortisol values were higher during the fall of 2011.

