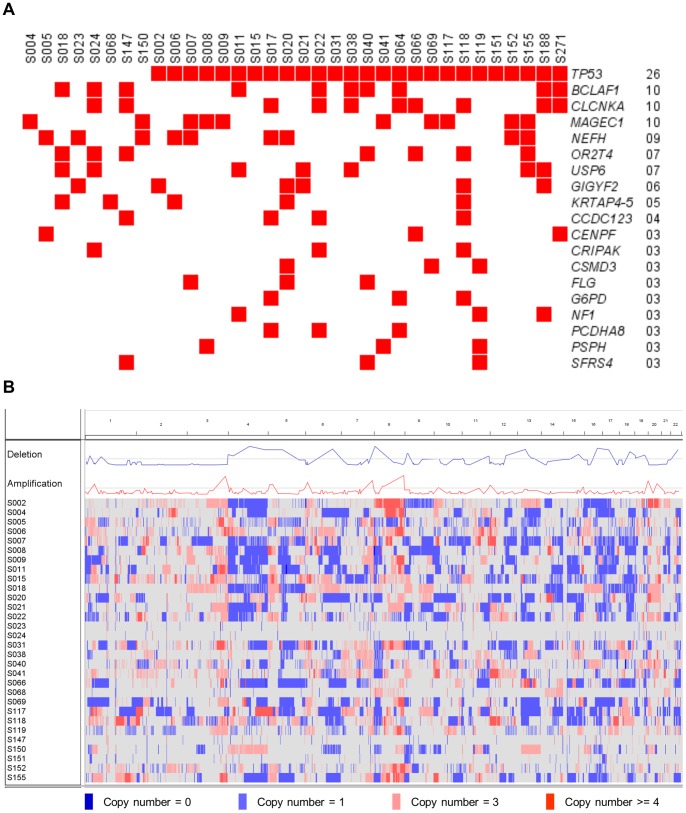
Figure 1. The landscape of genomic alterations in patients with HGSOC.
(A) Somatic mutational landscape of 34 patients with HGSOC. Somatic mutations identified in more than or equal to three patients are displayed. Patients with mutations of the same gene are shown in red. (B) Copy number alteration landscape of 30 patients with HGSOC. Copy number (CN) alterations are indicated as follows: CN = 0, dark blue; CN = 1, light blue; CN = 3, pink; and CN ≧4, red). Blue line in the Deletion track and red line in the Amplification track show copy number alteration frequency. Gray lines in the Deletion and Amplification tracks show the −log-transformed Fisher’s exact test p values of 0.0005.

