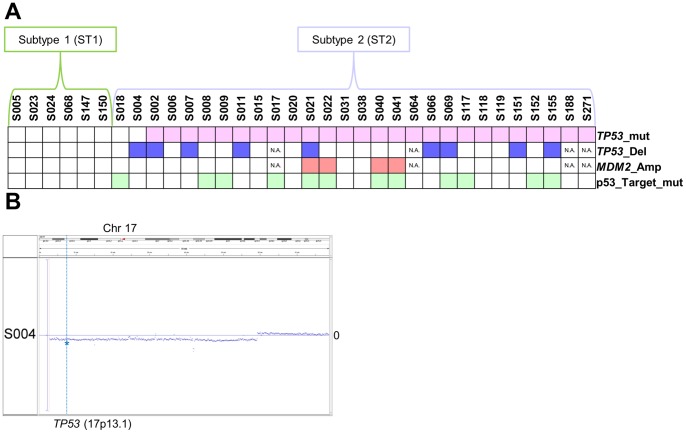
Figure 2. Summary of mutations for TP53 and p53 pathway genes.
(A) Summary of patients with TP53 mutations are shown in pink in the TP53_mut track. TP53 heterozygous copy number deletions are shown in blue in TP53_Del track. MDM2 copy number amplification is shown in red in the MDM2_amp track. Mutations in genes that are direct targets of p53 are shown in green in the p53_Target_mut track. (B) Dot plot of log R ratio (LRR) of Chr17 for sample S004. Blue dots indicate LRR values. The position of line of LRR = 0 is indicated as 0 on the right of each graph. TP53 (17p13.1) is indicated by the blue asterisk on the vertical line.

